<?xml version="1.0" encoding="utf-8"?><feed xmlns="http://www.w3.org/2005/Atom" ><generator uri="https://jekyllrb.com/" version="4.4.1">Jekyll</generator><link href="https://ryanveach.com/feed.xml" rel="self" type="application/atom+xml" /><link href="https://ryanveach.com/" rel="alternate" type="text/html" /><updated>2026-09-29T21:18:31-05:00</updated><id>https://ryanveach.com/feed.xml</id><title type="html">ryanveach.com</title><subtitle>My Digital Outlet</subtitle><author><name>Ryan Veach</name></author><entry><title type="html">ActivityStats - A Strava Add-On</title><link href="https://ryanveach.com/2024/04/26/activitystats-a-strava-add-on/" rel="alternate" type="text/html" title="ActivityStats - A Strava Add-On" /><published>2024-04-26T07:20:00-05:00</published><updated>2024-04-26T07:20:00-05:00</updated><id>https://ryanveach.com/2024/04/26/activitystats-a-strava-add-on</id><content type="html" xml:base="https://ryanveach.com/2024/04/26/activitystats-a-strava-add-on/"><![CDATA[<p>To help keep my mind occupied a couple years ago, I embarked on a winter project to help me visualize some unique insights into my Strava activities. Commits range from October 2021 through February 2023. It’s been a pretty fun project, but I’ve found that my mental health is better when I focus on hobbies that are not too similar to my work.</p>

<h2 id="activity-view">Activity View</h2>

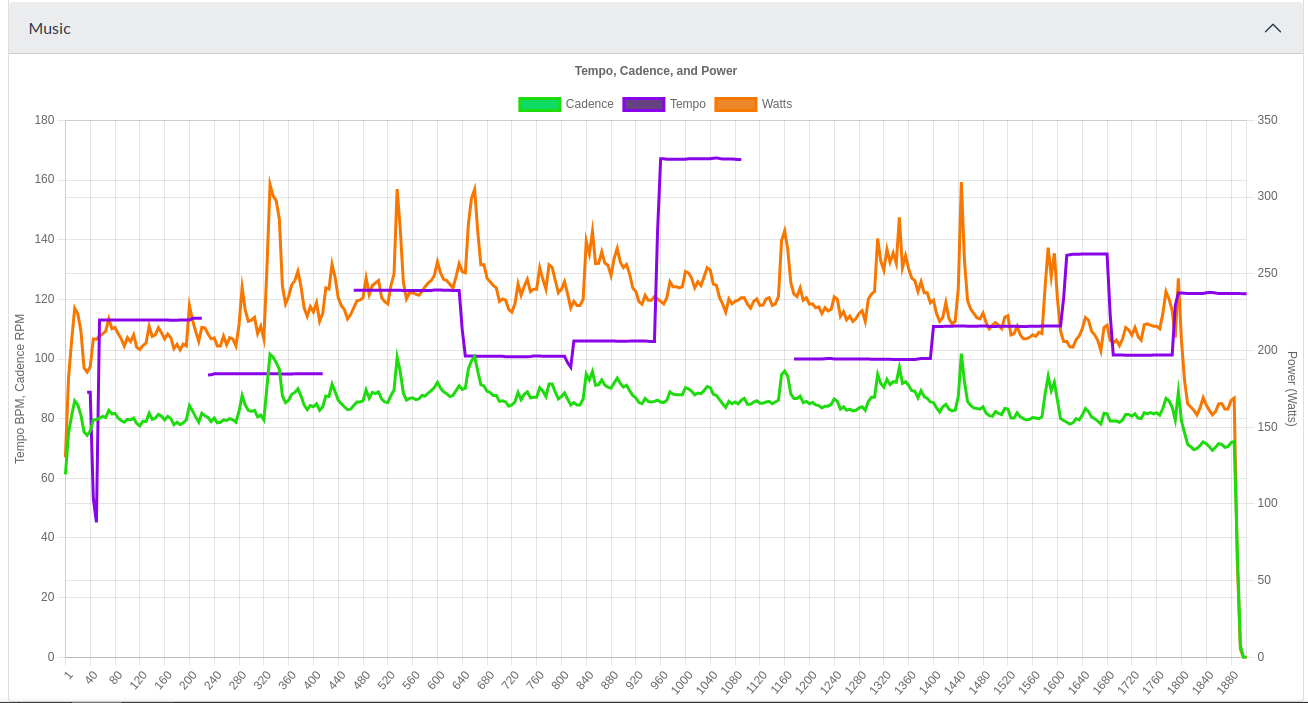
<p>One of my main motivations for starting this project was to attempt to correlate my cycling cadence and power with the tempo of the music I was listening to. The short answer is no, the environment (and virtual environment) seems to have much more of an effect than my music, but it was fun to visualize.</p>

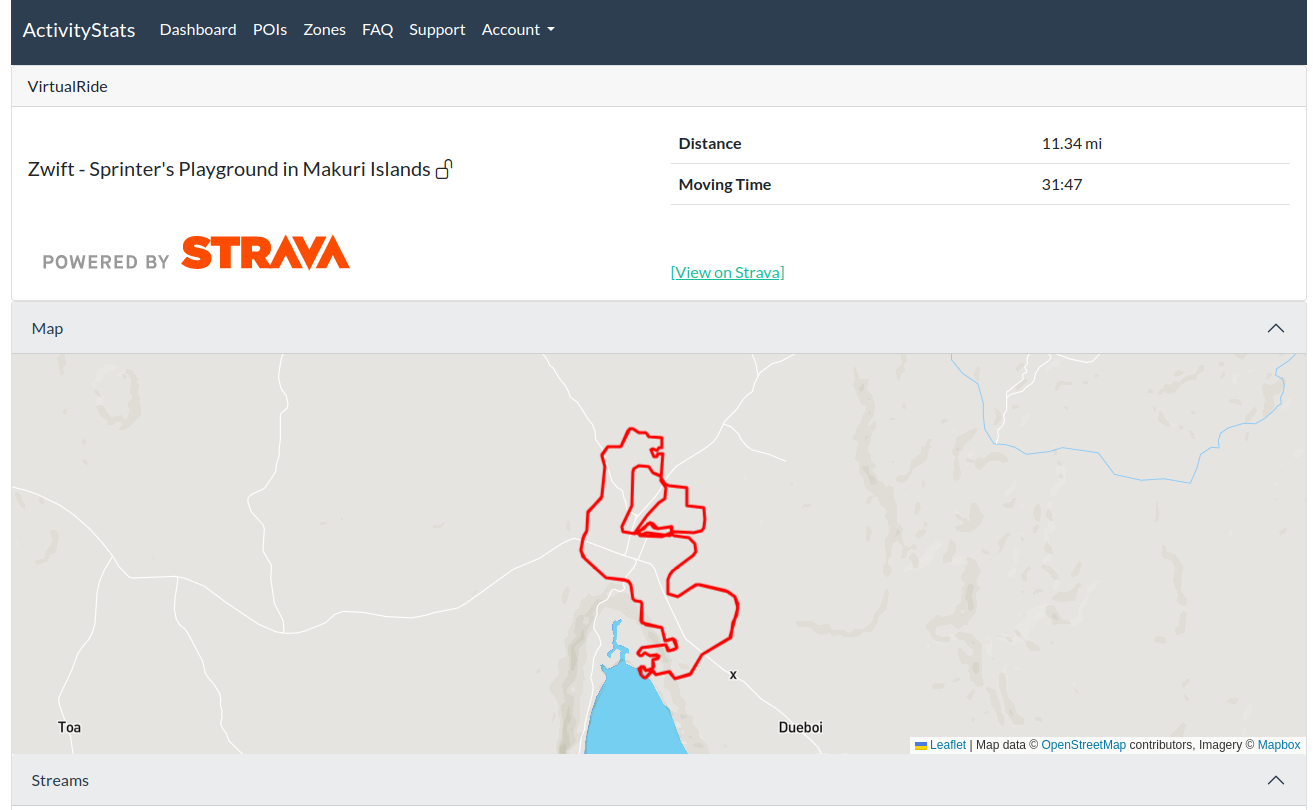
<p>Because we can’t be completely boring, I began with some basic stats and a map:</p>

<figure>
  <img src="/assets/images/2024/04/image.png" alt="" />
</figure>

<p>An activity view then shows some stats. First is a speed chart (which is unremarkable). Below that is a chart showing cycling cadence (revolutions per minute), tempo of the music (beats per minute), and power output (watts) together.</p>

<figure>
  <img src="/assets/images/2024/04/GclNFqWOSjLu3v0g-image.png" alt="" />
</figure>

<p>This was a pretty fun dataset to put together. The activity data is all pulled from the Strava API. This is combined with the user’s Spotify listening history. For each track, both the audio features and audio analysis are retrieved and stored. A large dataframe is then created merging all data, so it can be charted.</p>

<p>The Spotify API has a lot of other really cool metrics that could be charted as well, such as the acousticness, danceability, energy, liveness, loudness, and speechiness of a track. This is currently collected, but not displayed.</p>

<h2 id="zones">Zones</h2>

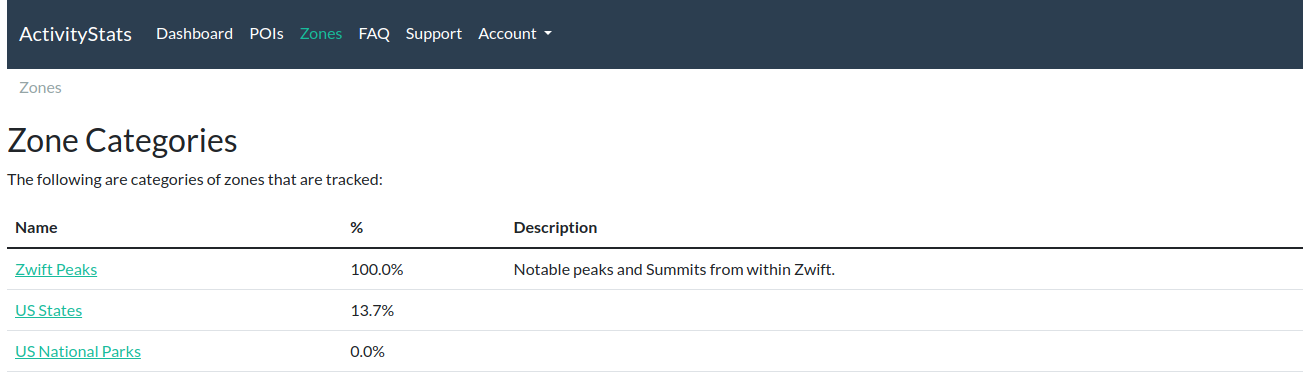
<p>I realized once I had a catalog of all my Strava data that I could analyze it against publicly available GIS data, such as all the US States and US National Parks. This involved taking multi-polygon objects from ArcGIS Hub and looking for intersections with the linestrings typically generated from Strava Activities. A third one was generated manually in <a href="https://www.qgis.org/">QGIS</a> to cover some of the climb peaks in Zwift.</p>

<figure>
  <img src="/assets/images/2024/04/image-1.png" alt="" />
</figure>

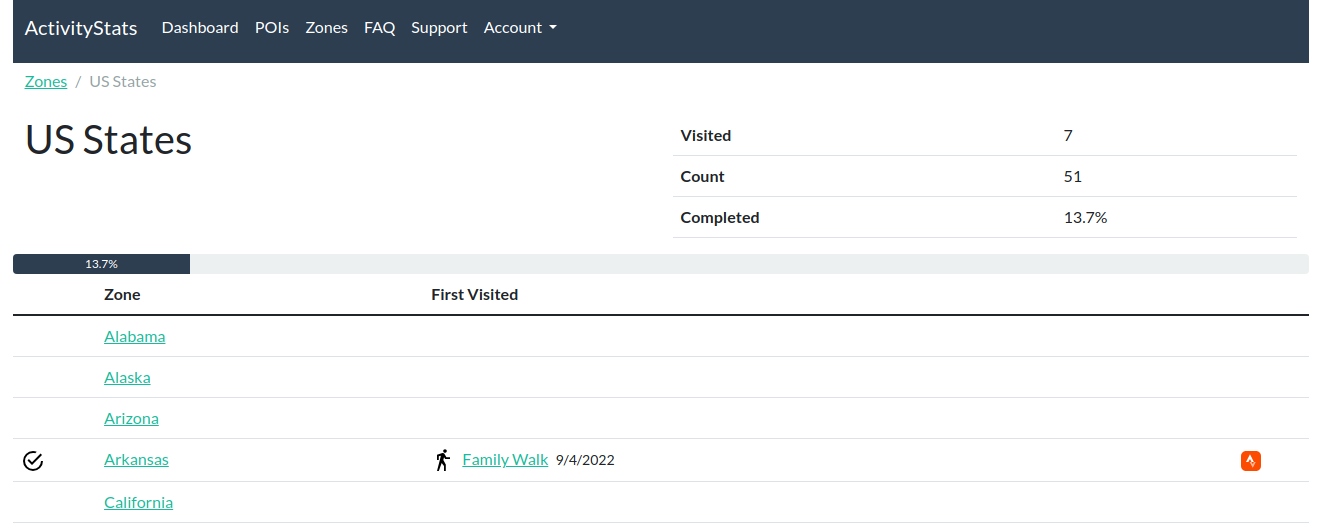
<p>The main page for a Zone category will show a percentage of completion, and a list of zones and the first activity completed in each.</p>

<figure>
  <img src="/assets/images/2024/04/image-2.png" alt="" />
</figure>

<p>When viewing a zone’s page, you can also see a map, some quick stats, the first activity created, a list of each activity completed in the zone:</p>

<figure>
  <img src="https://books.veach.tech/uploads/images/gallery/2024-04/scaled-1680-/Vg8rr4x9nDfppTsA-image.png" alt="image.png" />
</figure>

<h2 id="points-of-interest">Points of Interest</h2>

<p>In 2022, the <a href="https://theparadeofhearts.com/">Parade of Hearts</a> began in Kansas City, and my Strava feed was flooded with rides designed to see as many hearts as possible, and I wanted to support tracking this. While the zones could definitely be used to track this, I felt it was overall more efficient to store just the coordinate of each heart, and count visits as an activity that comes with a configurable distance of that coordinate. Therefore, POI’s were born, and because I didn’t want to spend my time doing data entry, I found a Google Maps list of the hearts, downloaded the .kml file, and scripted an import process.</p>

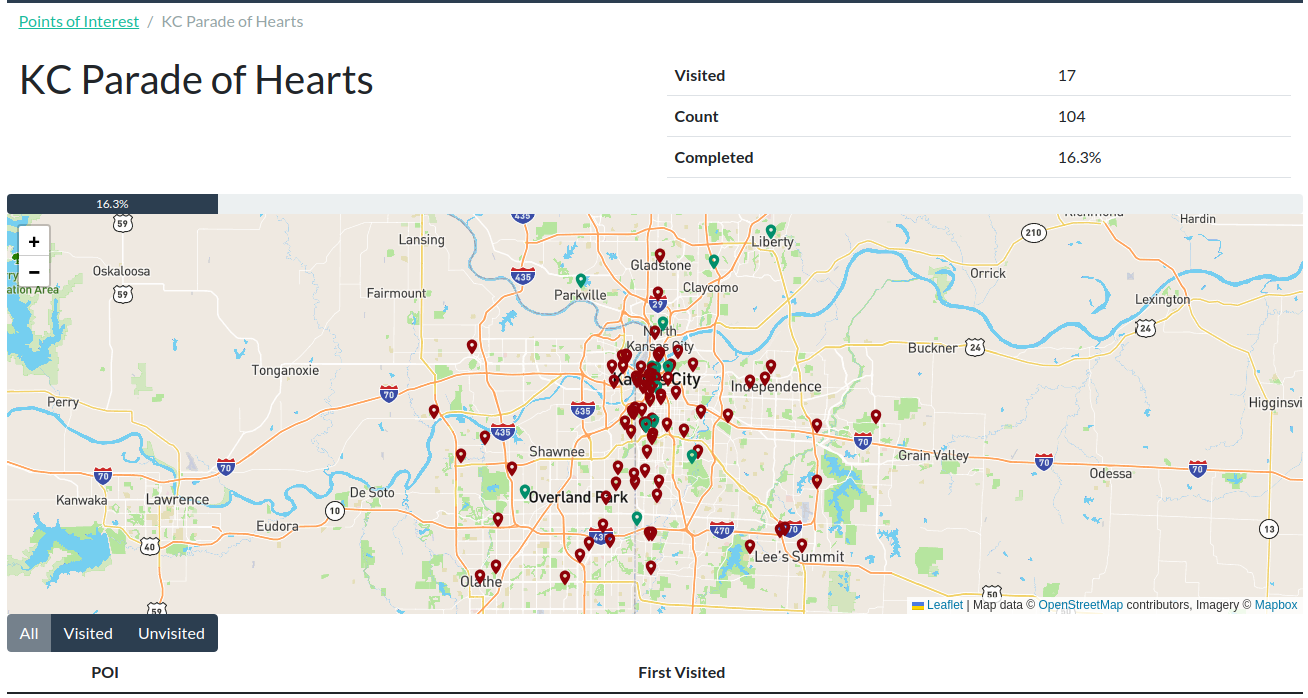
<p>A POI Category, like the Parade of Hearts, will show a few basic stats, a color coded map, and a list of each with visit information.</p>

<figure>
  <img src="/assets/images/2024/04/image-3.png" alt="" />
</figure>

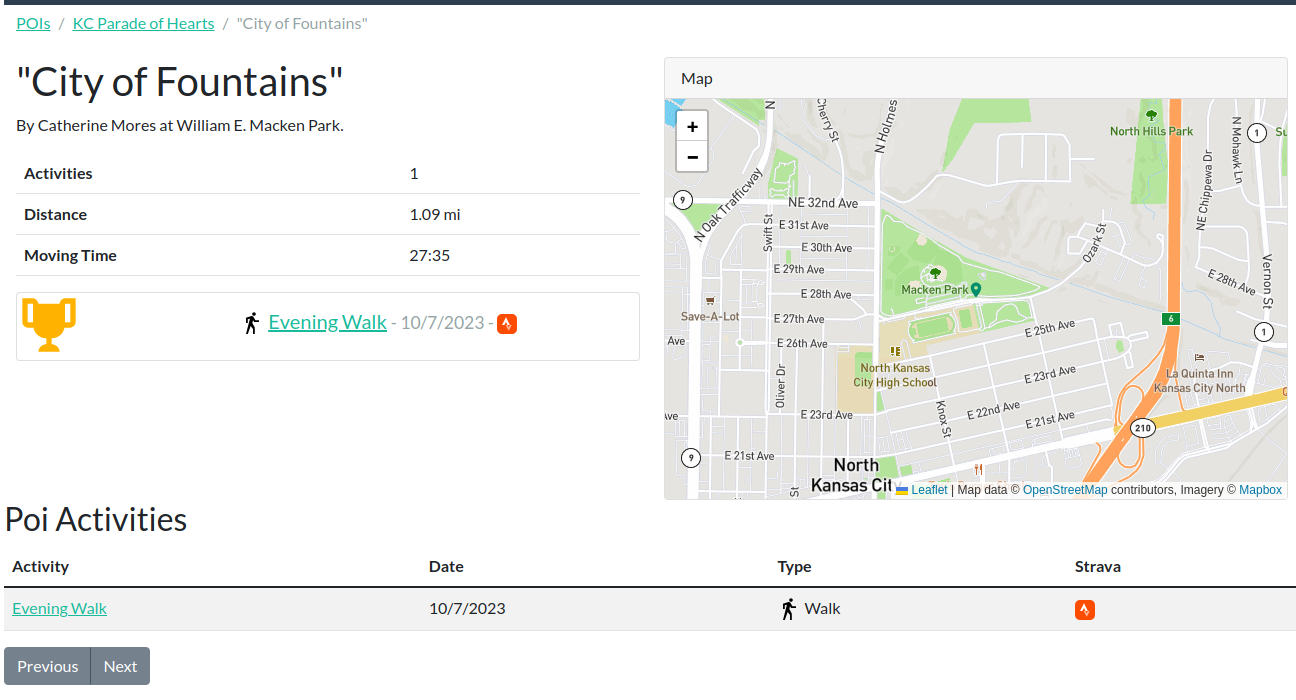
<p>Then, each POI will also have a page showing the point, the first activity visiting the point, and a list of all activities below.</p>

<figure>
  <img src="/assets/images/2024/04/image-4.png" alt="" />
</figure>

<h2 id="tech-stuff">Tech Stuff</h2>

<h4 id="backend">Backend</h4>

<p>The backend code is all Python. The bulk is <a href="https://www.djangoproject.com/">Django</a> with <a href="https://docs.djangoproject.com/en/5.0/ref/contrib/gis/">GeoDjango</a> to handle the maps and detection of object intersection and proximity. <a href="https://django-ninja.dev/">Django Ninja</a> was chosen as an API framework due to it’s simplicity, strong typing support, and Swagger page. The obvious choice for a database was <a href="https://www.postgresql.org/">PostgreSQL</a> with <a href="https://postgis.net/">PostGIS</a>.</p>

<p>In order to gather and analyze this data, a backend task framework called <a href="https://docs.celeryq.dev/">Celery</a> was used. <a href="https://redis.io/">Redis</a> was chosen as a message broker, as it’s use could later be expanded to include caching. All of the analysis took place using <a href="https://pandas.pydata.org/">Pandas</a>.</p>

<h4 id="frontend">Frontend</h4>

<p>I’m not really a frontend developer, so I relied heavily on <a href="https://getbootstrap.com/">Bootstrap</a> for the layout and <a href="https://bootswatch.com/">Bootswatch</a> for a better color scheme.</p>

<p>I used <a href="https://jquery.com/">JQuery</a>, <a href="https://www.chartjs.org/">Chart.js</a>, and <a href="https://leafletjs.com/">Leaflet.js</a> to put together my ajax views, draw charts, and maps. The map tiles all come from <a href="https://www.mapbox.com/">Mapbox</a>.</p>

<p>The basic page structure, like the layout and navigation menus are generated on the backend, but most of the page content is retrieved and rendered using ajax.</p>

<h4 id="automation-and-deployment">Automation and Deployment</h4>

<p>The code currently lives in a private <a href="https://gitlab.com/">GitLab</a> repo. GitLab CI is used to periodically rebuild docker images, which are then updated automatically via <a href="https://github.com/containrrr/watchtower">Watchtower</a>. While the code is not actively being worked on, weekly image updates are still performed to ensure up to date patches are applied to the base images.</p>

<h2 id="future-of-the-project">Future of the Project</h2>

<p>Working on this project is too similar to how I spend my days at work, so I’ve ceased active development to avoid burnout. I would love to see an enterprising developer or team fork the work, and continue development.</p>]]></content><author><name>Ryan Veach</name></author><category term="Project" /><category term="Python" /><category term="Strava" /><summary type="html"><![CDATA[To help keep my mind occupied a couple years ago, I embarked on a winter project to help me visualize some unique insights into my Strava activities. Commits range from October 2021 through February 2023. It’s been a pretty fun project, but I’ve found that my mental health is better when I focus on hobbies that are not too similar to my work.]]></summary></entry><entry><title type="html">Raspberry Pi Image Prep</title><link href="https://ryanveach.com/2021/02/04/raspberry-pi-image-prep/" rel="alternate" type="text/html" title="Raspberry Pi Image Prep" /><published>2021-02-04T18:38:24-06:00</published><updated>2021-02-04T18:38:24-06:00</updated><id>https://ryanveach.com/2021/02/04/raspberry-pi-image-prep</id><content type="html" xml:base="https://ryanveach.com/2021/02/04/raspberry-pi-image-prep/"><![CDATA[<figure>
  <img src="/assets/images/2021/02/vishnu-mohanan-rZKdS0wI8Ks-unsplash.jpg" alt="Raspberry Pi" />
  <figcaption>Photo by <a href="https://unsplash.com/@vishnumaiea?utm_source=unsplash&amp;utm_medium=referral&amp;utm_content=creditCopyText">Vishnu Mohanan</a> on <a href="https://unsplash.com/s/photos/raspberry-pi?utm_source=unsplash&amp;utm_medium=referral&amp;utm_content=creditCopyText">Unsplash</a></figcaption>
</figure>

<p>Over the years, I’ve set up a <em>lot</em> of Raspberry Pi’s, which usually requires I pull out a spare keyboard and monitor to do basic configuration, which gets really annoying.</p>

<p>Inspired by the <a href="https://www.pibakery.org/">PiBakery</a> project, I decided to do something about it. Introducing <a href="https://pypi.org/project/pi-image-prep/">pi-image-prep</a>:</p>

<figure>
  <img src="/assets/images/2021/02/pi-image-prep.gif" alt="Animation showing the script in use" />
  <figcaption><a rel="noreferrer noopener" href="https://asciinema.org/a/389175" target="_blank">View on Asciinema for a larger video</a></figcaption>
</figure>

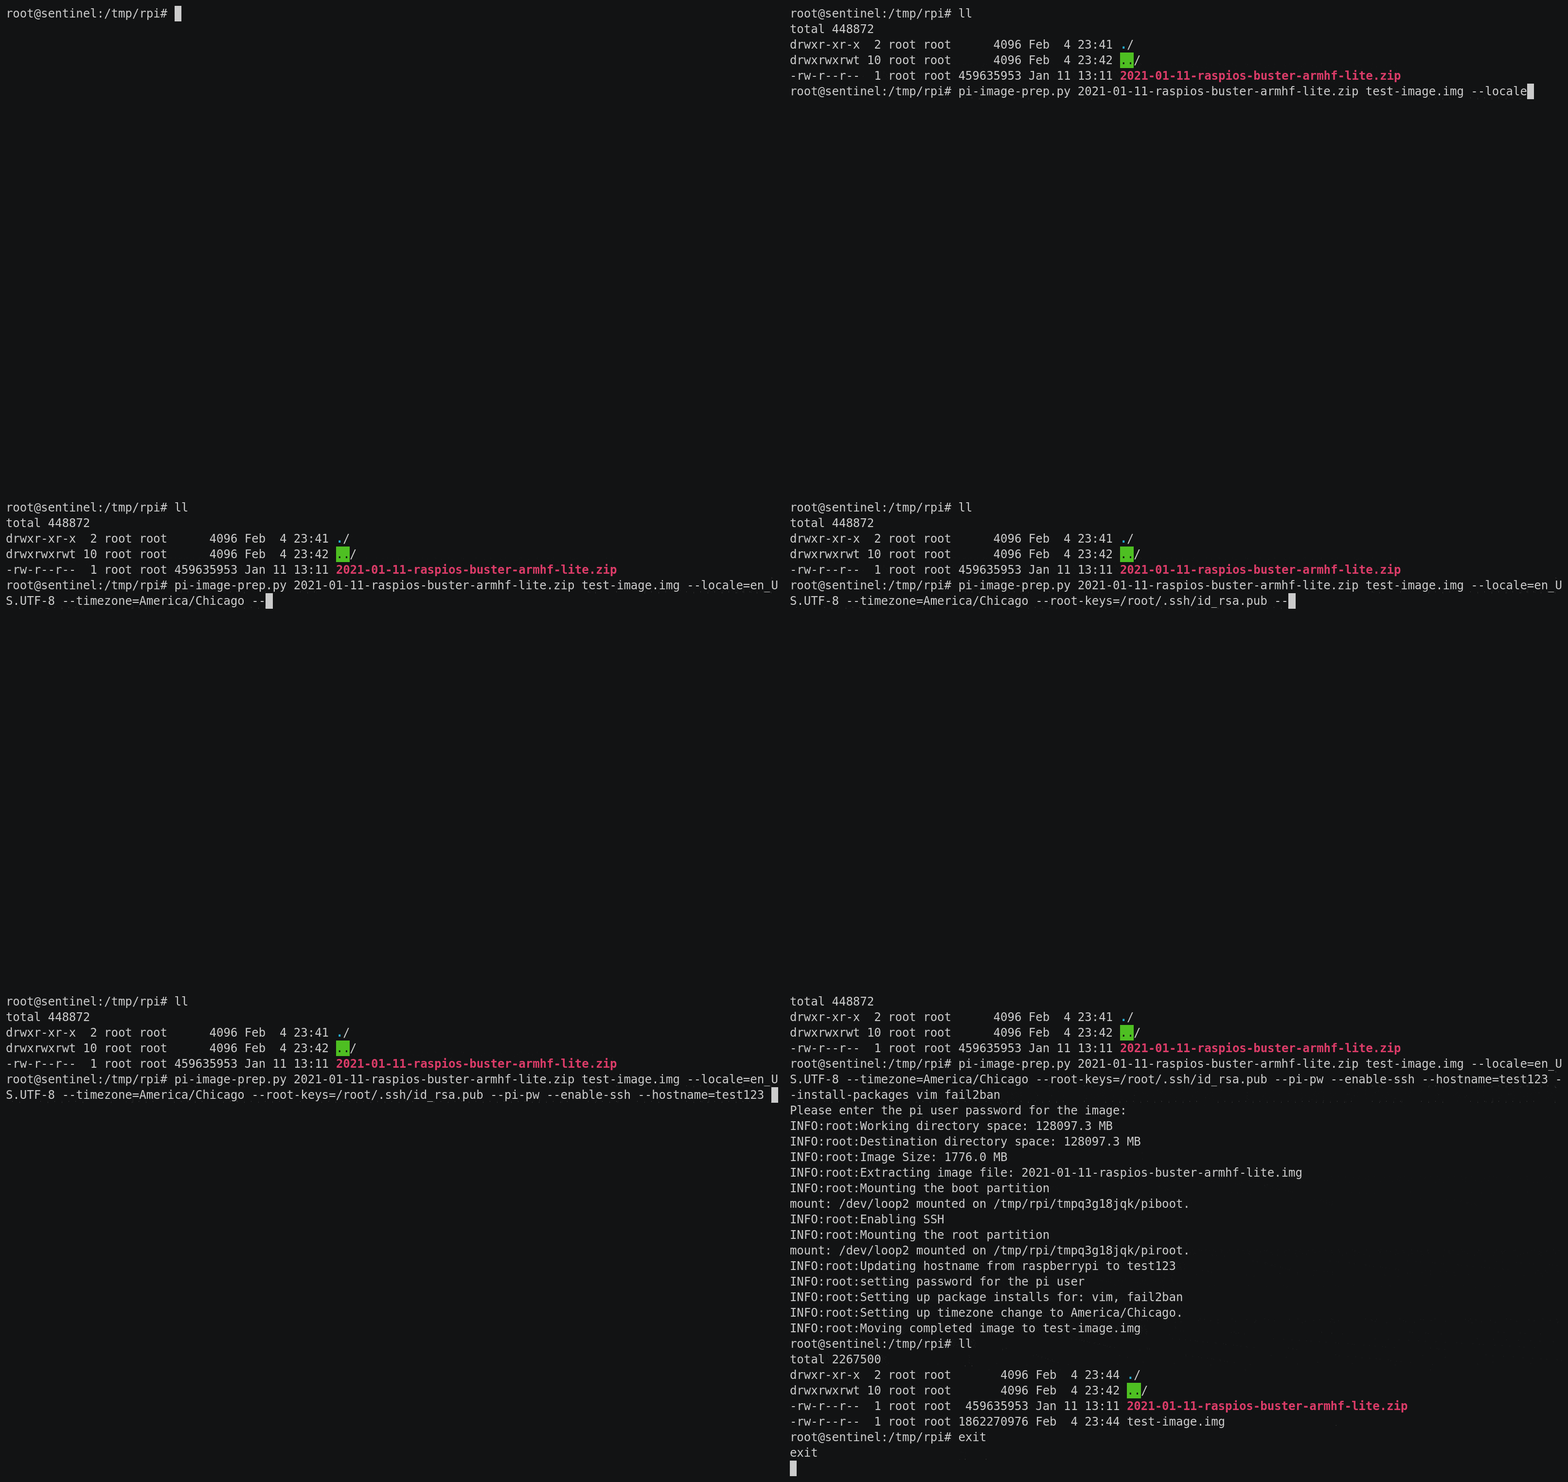
<p>This is a simple python script to help prepare a raspberry pi image in a matter of minutes. Currently, it can do the following:</p>

<ul>
  <li>Set system locale</li>
  <li>Set system timezone</li>
  <li>Set passwords for root and pi users</li>
  <li>Add authorized keys for root and pi users</li>
  <li>Enable ssh</li>
  <li>Set hostname</li>
  <li>Enable WiFi</li>
  <li>Install packages by name</li>
</ul>

<p>In order to do this, it will mount both boot and root partitions within a temporary location on the host computer.</p>

<p>Some changes such as the hostname, SSH, WiFi, and authorized keys are implemented on the image directly. Many others can only be implemented after the first boot. These are handled by placing a temporary script within <code class="language-plaintext highlighter-rouge">/etc/cron.d/</code>.</p>

<p>In particular, note there is a very small window in which a Raspberry Pi could be connected to the network with the default pi user password. In practice, this would be extremely difficult to exploit, except in a situation where the password change fails for an unexpected reason.</p>

<p>This script is designed to run only on Linux systems, and requires root <em>(for now)</em>, and can be installed via pip:</p>

<div class="language-plaintext highlighter-rouge"><div class="highlight"><pre class="highlight"><code>sudo pip3 install pi-image-prep
</code></pre></div></div>

<p>Visit the following locations for more information:</p>

<ul>
  <li><a href="https://pypi.org/project/pi-image-prep/">pypi.org/project/pi-image-prep/</a> for download and usage information</li>
  <li><a href="https://gitlab.com/rveach/pi-image-prep/">gitlab.com/rveach/pi-image-prep</a> for the source or to report bugs</li>
</ul>]]></content><author><name>Ryan Veach</name></author><category term="Homelab" /><category term="Raspberry Pi" /><category term="Automation" /><category term="Linux" /><category term="Python" /><category term="Raspberry Pi" /><summary type="html"><![CDATA[Photo by Vishnu Mohanan on Unsplash]]></summary></entry><entry><title type="html">Breaking Down Fitness Data Barriers</title><link href="https://ryanveach.com/2020/09/06/breaking-down-fitness-data-barriers/" rel="alternate" type="text/html" title="Breaking Down Fitness Data Barriers" /><published>2020-09-06T00:20:49-05:00</published><updated>2020-09-06T00:20:49-05:00</updated><id>https://ryanveach.com/2020/09/06/breaking-down-fitness-data-barriers</id><content type="html" xml:base="https://ryanveach.com/2020/09/06/breaking-down-fitness-data-barriers/"><![CDATA[<p>About a year ago, I got into cycling. Naturally, since I’m a bit of a data nerd, I started tracking my rides, so I could keep track of my progress. For the unaware, cycling can be a pretty expensive hobby, so in starting out, I chose to use my phone for GPS tracking using <a href="https://www.strava.com/">Strava</a> and <a href="https://ridewithgps.com/">RideWithGPS</a>. I honestly had no complaints, until I wanted to add in my heart rate….</p>

<p>In trying to keep with what I already own, I dusted off my cracked Fitbit Versa, attempted to seal the crack, strapped it on, and tried it out. While it will record cycling activities, the resulting data only recorded tracking points every 5 seconds. This is nowhere near the 1 second accuracy I’m able to get using the phone apps. While many would stop here and just chose to live with lower accuracy or lack of heart rate, I chose to press on and make it work.</p>

<h1 id="data-flow">Data Flow</h1>

<p>In order for this to work, I knew I needed both GPS location from an app on my phone plus heart rate from my Fitbit. Because app allows deleting or modifying an existing ride, I needed to choose one app to record, and another to visualize. This choice was rather easy, because I feel that RideWithGPS is better for riding and Strava is better for Social.</p>

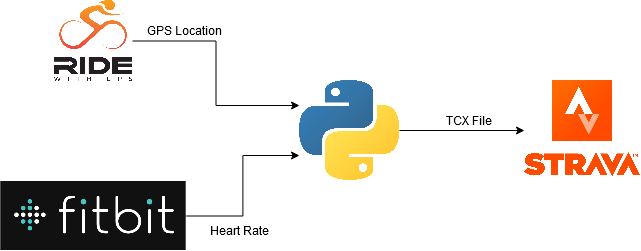
<p>My plan was to pull data from RideWithGPS and Fitbit API’s, combine it, then format it so it could be read by Strava (TCX).</p>

<p>I chose to write this as a Python script. Due to some previous work I’d done to analyze my stats, I chose to write it as a management script for an existing Django project, but I will try to focus on the more unique aspects of this task.</p>

<figure>
  <img src="/assets/images/2020/09/mergehr-flow.png" alt="" />
</figure>

<h1 id="location-data-from-ridewithgps">Location Data from RideWithGPS</h1>

<p>For me, GPS logging is the most critical piece of information. I really enjoy tracking and conquering my personal bests on <a href="https://support.strava.com/hc/en-us/articles/216918167-Strava-Segments">Strava Segments</a>, so this is my primary data source. I did not want to alter it any way, just merge in the heart rate information where possible.</p>

<p>Before I even got started, I recorded a test ride with RideWithGPS, and found that it only recorded every other second, but luckily, that’s <a href="https://ridewithgps.com/help/manage-settings-on-mobile#logging">easily configured in the settings</a>.</p>

<p>Their API is simple, but easy to navigate. It’s possible to get a list of a user’s ride, then pull individual ride details. Nested a couple layers deep in the ride details, we’re given elevation (meters), time (unix timestamp), x (longitude), and y (latitude).</p>

<div class="language-json highlighter-rouge"><div class="highlight"><pre class="highlight"><code><span class="p">{</span><span class="w">
  </span><span class="nl">"e"</span><span class="p">:</span><span class="w"> </span><span class="mf">236.4815364</span><span class="p">,</span><span class="w">
  </span><span class="nl">"t"</span><span class="p">:</span><span class="w"> </span><span class="mi">1598482303</span><span class="p">,</span><span class="w">
  </span><span class="nl">"x"</span><span class="p">:</span><span class="w"> </span><span class="mf">-94.4359419</span><span class="p">,</span><span class="w">
  </span><span class="nl">"y"</span><span class="p">:</span><span class="w"> </span><span class="mf">39.2367653</span><span class="w">
</span><span class="p">}</span><span class="err">,</span><span class="w">
</span><span class="p">{</span><span class="w">
  </span><span class="nl">"e"</span><span class="p">:</span><span class="w"> </span><span class="mf">236.4665218</span><span class="p">,</span><span class="w">
  </span><span class="nl">"t"</span><span class="p">:</span><span class="w"> </span><span class="mi">1598482304</span><span class="p">,</span><span class="w">
  </span><span class="nl">"x"</span><span class="p">:</span><span class="w"> </span><span class="mf">-94.435941</span><span class="p">,</span><span class="w">
  </span><span class="nl">"y"</span><span class="p">:</span><span class="w"> </span><span class="mf">39.2367631</span><span class="w">
</span><span class="p">}</span><span class="err">,</span><span class="w">
</span></code></pre></div></div>

<p>In my script, I used <a href="https://requests.readthedocs.io/en/master/">requests</a> to pull the data, resulting in a dictionary-like object. That’s fine, but Pandas is better….</p>

<div class="language-python highlighter-rouge"><div class="highlight"><pre class="highlight"><code><span class="kn">import</span> <span class="n">pandas</span> <span class="k">as</span> <span class="n">pd</span>

<span class="n">activity_df</span> <span class="o">=</span> <span class="n">pd</span><span class="p">.</span><span class="nc">DataFrame</span><span class="p">(</span>
    <span class="n">ride_detail</span><span class="p">.</span><span class="nf">get</span><span class="p">(</span><span class="sh">'</span><span class="s">trip</span><span class="sh">'</span><span class="p">).</span><span class="nf">get</span><span class="p">(</span><span class="sh">'</span><span class="s">track_points</span><span class="sh">'</span><span class="p">)</span>
<span class="p">)</span>
</code></pre></div></div>

<p>What we get is something like this:</p>

<div class="language-plaintext highlighter-rouge"><div class="highlight"><pre class="highlight"><code>                 e             x            y             t
   0    236.481536    -94.435942    39.236765    1598482303
   1    236.466522    -94.435941    39.236763    1598482403
   2    236.344946    -94.435940    39.236762    1598482503
   3    236.278519    -94.435938    39.236762    1598482603
   4    236.260699    -94.435933    39.236764    1598482703
...            ...           ...          ...           ...
4798    234.847334    -94.435919    39.236706    1598531700
4799    234.841117    -94.435915    39.236708    1598531701
4800    234.942241    -94.435913    39.236708    1598531702
4801    234.961215    -94.435914    39.236708    1598531703
4802    234.858422    -94.435909    39.236709    1598531704
</code></pre></div></div>

<p>So, let’s turn those integer timestamps into real timestamps with time zones. While we’re at it, let’s rename some columns to match the TCX spec:</p>

<div class="language-python highlighter-rouge"><div class="highlight"><pre class="highlight"><code><span class="kn">import</span> <span class="n">datetime</span>
<span class="kn">import</span> <span class="n">pytz</span>
<span class="kn">from</span> <span class="n">django.utils.timezone</span> <span class="kn">import</span> <span class="n">make_aware</span>

<span class="c1"># get a utc timezone object
</span><span class="n">utcz</span> <span class="o">=</span> <span class="n">pytz</span><span class="p">.</span><span class="nf">timezone</span><span class="p">(</span><span class="sh">'</span><span class="s">utc</span><span class="sh">'</span><span class="p">)</span>

<span class="k">def</span> <span class="nf">get_dt</span><span class="p">(</span><span class="n">time_stamp</span><span class="p">:</span><span class="nb">int</span><span class="p">):</span>
    <span class="sh">"""</span><span class="s"> convert timestamp to timezone aware datetime </span><span class="sh">"""</span>
    <span class="k">return</span> <span class="nf">make_aware</span><span class="p">(</span>
        <span class="n">datetime</span><span class="p">.</span><span class="n">datetime</span><span class="p">.</span><span class="nf">utcfromtimestamp</span><span class="p">(</span><span class="n">time_stamp</span><span class="p">),</span>
        <span class="n">timezone</span><span class="o">=</span><span class="n">utcz</span><span class="p">,</span>
<span class="p">)</span>

<span class="c1"># create a new Column 'Time', and populate
# it with timezone-aware timezones
</span><span class="n">activity_df</span><span class="p">[</span><span class="sh">'</span><span class="s">Time</span><span class="sh">'</span><span class="p">]</span> <span class="o">=</span> <span class="n">activity_df</span><span class="p">[</span><span class="sh">'</span><span class="s">t</span><span class="sh">'</span><span class="p">].</span><span class="nf">apply</span><span class="p">(</span><span class="n">self</span><span class="p">.</span><span class="n">ts_to_dt</span><span class="p">)</span>

<span class="c1"># rename some columns to match TCX Spec, and drop 't'
# which is no longer needed.
</span><span class="n">activity_df</span><span class="p">.</span><span class="nf">rename</span><span class="p">(</span>
    <span class="n">columns</span><span class="o">=</span><span class="p">{</span>
        <span class="sh">"</span><span class="s">y</span><span class="sh">"</span><span class="p">:</span> <span class="sh">"</span><span class="s">LatitudeDegrees</span><span class="sh">"</span><span class="p">,</span>
        <span class="sh">"</span><span class="s">x</span><span class="sh">"</span><span class="p">:</span> <span class="sh">"</span><span class="s">LongitudeDegrees</span><span class="sh">"</span><span class="p">,</span>
        <span class="sh">"</span><span class="s">e</span><span class="sh">"</span><span class="p">:</span> <span class="sh">"</span><span class="s">AltitudeMeters</span><span class="sh">"</span><span class="p">,</span>
    <span class="p">},</span>
    <span class="n">inplace</span><span class="o">=</span><span class="bp">True</span><span class="p">,</span>
<span class="p">)</span>
<span class="n">activity_df</span><span class="p">.</span><span class="nf">drop</span><span class="p">(</span><span class="n">columns</span><span class="o">=</span><span class="p">[</span><span class="sh">'</span><span class="s">t</span><span class="sh">'</span><span class="p">],</span> <span class="n">inplace</span><span class="o">=</span><span class="bp">True</span><span class="p">)</span>
</code></pre></div></div>

<p>This gives us something a little more human readable:</p>

<div class="language-plaintext highlighter-rouge"><div class="highlight"><pre class="highlight"><code>      AltitudeMeters  LongitudeDegrees  LatitudeDegrees                      Time
0         236.481536        -94.435942        39.236765 2020-08-26 22:51:43+00:00
1         236.466522        -94.435941        39.236763 2020-08-26 22:51:44+00:00
2         236.344946        -94.435940        39.236762 2020-08-26 22:51:45+00:00
3         236.278519        -94.435938        39.236762 2020-08-26 22:51:46+00:00
4         236.260699        -94.435933        39.236764 2020-08-26 22:51:47+00:00
...              ...               ...              ...                       ...
4798      234.847334        -94.435919        39.236706 2020-08-27 00:35:00+00:00
4799      234.841117        -94.435915        39.236708 2020-08-27 00:35:01+00:00
4800      234.942241        -94.435913        39.236708 2020-08-27 00:35:02+00:00
4801      234.961215        -94.435914        39.236708 2020-08-27 00:35:03+00:00
4802      234.858422        -94.435909        39.236709 2020-08-27 00:35:04+00:00
</code></pre></div></div>

<h1 id="retrieving-heart-rate-data">Retrieving Heart Rate Data</h1>

<p>In order to pull minute-by-minute data from the Fitbit API, I had to create a “Personal” project, which would only allow me access to my own fitness data. This is done through the <a href="https://dev.fitbit.com/build/reference/web-api/heart-rate/#get-heart-rate-intraday-time-series">Heart Rate Intraday Time Series</a> endpoints.</p>

<p>The data was returned with time only, missing date and timezone information. It actually looks something like this, yikes!</p>

<div class="language-json highlighter-rouge"><div class="highlight"><pre class="highlight"><code><span class="w">    </span><span class="nl">"activities-heart-intraday"</span><span class="p">:</span><span class="w"> </span><span class="p">{</span><span class="w">
        </span><span class="nl">"dataset"</span><span class="p">:</span><span class="w"> </span><span class="p">[</span><span class="w">
            </span><span class="p">{</span><span class="w">
                </span><span class="nl">"time"</span><span class="p">:</span><span class="w"> </span><span class="s2">"00:00:00"</span><span class="p">,</span><span class="w">
                </span><span class="nl">"value"</span><span class="p">:</span><span class="w"> </span><span class="mi">64</span><span class="w">
            </span><span class="p">},</span><span class="w">
            </span><span class="p">{</span><span class="w">
                </span><span class="nl">"time"</span><span class="p">:</span><span class="w"> </span><span class="s2">"00:00:10"</span><span class="p">,</span><span class="w">
                </span><span class="nl">"value"</span><span class="p">:</span><span class="w"> </span><span class="mi">63</span><span class="w">
            </span><span class="p">}</span><span class="w">
        </span><span class="p">],</span><span class="w">
        </span><span class="nl">"datasetInterval"</span><span class="p">:</span><span class="w"> </span><span class="mi">1</span><span class="p">,</span><span class="w">
        </span><span class="nl">"datasetType"</span><span class="p">:</span><span class="w"> </span><span class="s2">"second"</span><span class="w">
    </span><span class="p">}</span><span class="w">
</span></code></pre></div></div>

<p>Luckily, the timezone can be retrieved through the user’s profile endpoint, which returns the timezone name. In my case, ‘America/Chicago’.</p>

<p>Before going any further, let’s add a column to our first DataFrame displaying our time in the same zone as Fitbit:</p>

<div class="language-python highlighter-rouge"><div class="highlight"><pre class="highlight"><code><span class="c1"># fitbit_tz is a dictionary object representing the response
# from the user's profile api endpoint.
# returns: America/Chicago
</span><span class="n">fitbit_tz</span> <span class="o">=</span> <span class="n">pytz</span><span class="p">.</span><span class="nf">timezone</span><span class="p">(</span>
    <span class="n">fitbit_profile</span><span class="p">.</span><span class="nf">get</span><span class="p">(</span><span class="sh">'</span><span class="s">user</span><span class="sh">'</span><span class="p">).</span><span class="nf">get</span><span class="p">(</span><span class="sh">'</span><span class="s">timezone</span><span class="sh">'</span><span class="p">)</span>
<span class="p">)</span>

<span class="c1"># We're going to add a new column, 'FitbitTZ' in addition
# to the other ones:
</span><span class="n">activity_df</span><span class="p">[</span><span class="sh">'</span><span class="s">FitbitTZ</span><span class="sh">'</span><span class="p">]</span> <span class="o">=</span> <span class="n">activity_df</span><span class="p">[</span><span class="sh">'</span><span class="s">Time</span><span class="sh">'</span><span class="p">].</span><span class="nf">apply</span><span class="p">(</span>
    <span class="k">lambda</span> <span class="n">x</span><span class="p">:</span> <span class="n">x</span><span class="p">.</span><span class="nf">tz_convert</span><span class="p">(</span><span class="n">fitbit_tz</span><span class="p">)</span>
<span class="p">)</span>
</code></pre></div></div>

<p>Here, you can see the new column. It’s the same timestamp, just displayed in a different timezone. To keep everything on one line, I’ve removed the coordinate and altitude columns to showcase the time zones:</p>

<div class="language-plaintext highlighter-rouge"><div class="highlight"><pre class="highlight"><code>                            Time                  FitbitTZ
0      2020-08-26 22:51:43+00:00 2020-08-26 17:51:43-05:00
1      2020-08-26 22:51:44+00:00 2020-08-26 17:51:44-05:00
2      2020-08-26 22:51:45+00:00 2020-08-26 17:51:45-05:00
3      2020-08-26 22:51:46+00:00 2020-08-26 17:51:46-05:00
4      2020-08-26 22:51:47+00:00 2020-08-26 17:51:47-05:00
...                          ...                       ...
4798   2020-08-27 00:35:00+00:00 2020-08-26 19:35:00-05:00
4799   2020-08-27 00:35:01+00:00 2020-08-26 19:35:01-05:00
4800   2020-08-27 00:35:02+00:00 2020-08-26 19:35:02-05:00
4801   2020-08-27 00:35:03+00:00 2020-08-26 19:35:03-05:00
4802   2020-08-27 00:35:04+00:00 2020-08-26 19:35:04-05:00
</code></pre></div></div>

<p>In my testing, I found that the Fitbit Heart Rate Intraday Series wouldn’t return more than 24 hours of data, and to avoid complex logic, I just did full day data pulls for each day found in the activity.</p>

<p>Pandas makes it easy to get a unique list of the dates:</p>

<div class="language-python highlighter-rouge"><div class="highlight"><pre class="highlight"><code><span class="n">fitbit_dates</span> <span class="o">=</span> <span class="n">activity_df</span><span class="p">[</span><span class="sh">'</span><span class="s">FitbitTZ</span><span class="sh">'</span><span class="p">].</span><span class="nf">apply</span><span class="p">(</span>
    <span class="k">lambda</span> <span class="n">x</span><span class="p">:</span> <span class="n">x</span><span class="p">.</span><span class="nf">date</span><span class="p">()</span>
<span class="p">).</span><span class="nf">unique</span><span class="p">().</span><span class="nf">tolist</span><span class="p">()</span>
</code></pre></div></div>

<p>Then, for each date, we retrieve a dictionary object, and turn those date strings into a dictionary object reflecting a timezone-naive datetime paired with the heart rate value.</p>

<p>Where <code class="language-plaintext highlighter-rouge">hr_data</code> is a dictionary object from the API and <code class="language-plaintext highlighter-rouge">day</code> is a datetime.date object:</p>

<div class="language-python highlighter-rouge"><div class="highlight"><pre class="highlight"><code><span class="n">hr_series</span> <span class="o">=</span> <span class="nf">list</span><span class="p">(</span><span class="nf">map</span><span class="p">(</span>
    <span class="k">lambda</span> <span class="n">x</span><span class="p">:</span> <span class="p">{</span>
        <span class="sh">"</span><span class="s">time</span><span class="sh">"</span><span class="p">:</span> <span class="n">datetime</span><span class="p">.</span><span class="n">datetime</span><span class="p">.</span><span class="nf">combine</span><span class="p">(</span>
            <span class="n">day</span><span class="p">,</span>
            <span class="n">datetime</span><span class="p">.</span><span class="n">datetime</span><span class="p">.</span><span class="nf">strptime</span><span class="p">(</span><span class="n">x</span><span class="p">.</span><span class="nf">get</span><span class="p">(</span><span class="sh">'</span><span class="s">time</span><span class="sh">'</span><span class="p">),</span> <span class="sh">'</span><span class="s">%H:%M:%S</span><span class="sh">'</span><span class="p">).</span><span class="nf">time</span><span class="p">(),</span>
        <span class="p">),</span>
        <span class="sh">"</span><span class="s">value</span><span class="sh">"</span><span class="p">:</span> <span class="n">x</span><span class="p">.</span><span class="nf">get</span><span class="p">(</span><span class="sh">'</span><span class="s">value</span><span class="sh">'</span><span class="p">),</span>
    <span class="p">},</span>
    <span class="n">hr_data</span><span class="p">.</span><span class="nf">get</span><span class="p">(</span><span class="sh">'</span><span class="s">activities-heart-intraday</span><span class="sh">'</span><span class="p">).</span><span class="nf">get</span><span class="p">(</span><span class="sh">'</span><span class="s">dataset</span><span class="sh">'</span><span class="p">),</span>
<span class="p">))</span>
</code></pre></div></div>

<p>That data is then converted into yet another Pandas DataFrame, where we use <code class="language-plaintext highlighter-rouge">django.utils.timezone.make_aware</code> again to add the correct timezone onto the data. I’ll name it <code class="language-plaintext highlighter-rouge">hr_df</code>, for short:</p>

<div class="language-plaintext highlighter-rouge"><div class="highlight"><pre class="highlight"><code>        hr                      hr_time
0       61    2020-08-26 00:00:04-05:00
1       60    2020-08-26 00:00:14-05:00
2       59    2020-08-26 00:00:24-05:00
3       58    2020-08-26 00:00:29-05:00
4       57    2020-08-26 00:00:34-05:00
...     ..                          ...
5894    90    2020-08-26 20:09:26-05:00
5895    91    2020-08-26 20:09:41-05:00
5896    91    2020-08-26 20:09:56-05:00
5897    89    2020-08-26 20:10:01-05:00
5898    88    2020-08-26 20:10:06-05:00
</code></pre></div></div>

<h1 id="merging-the-data">Merging the Data</h1>

<p>Now, we have two different data sets, both stored in Pandas DataFrames. Each contains timeseries data, but the times don’t match. Thankfully, this is easily solved with <a href="https://pandas.pydata.org/pandas-docs/stable/reference/api/pandas.merge_asof.html">Pandas’s merge_asof</a> method. This is like a database left join, except it will match on the nearest key rather than equal keys. Perfect!</p>

<p>As previously mentioned, our GPS information is the critical piece, so we’re going to use that as our left table, and merge in the heart rate data as a best fit:</p>

<div class="language-python highlighter-rouge"><div class="highlight"><pre class="highlight"><code><span class="n">activity_df</span> <span class="o">=</span> <span class="n">pd</span><span class="p">.</span><span class="nf">merge_asof</span><span class="p">(</span>
    <span class="n">activity_df</span><span class="p">.</span><span class="nf">sort_values</span><span class="p">(</span><span class="sh">"</span><span class="s">FitbitTZ</span><span class="sh">"</span><span class="p">),</span>
    <span class="n">hr_df</span><span class="p">.</span><span class="nf">sort_values</span><span class="p">(</span><span class="sh">"</span><span class="s">hr_time</span><span class="sh">"</span><span class="p">),</span>
    <span class="n">left_on</span><span class="o">=</span><span class="sh">"</span><span class="s">FitbitTZ</span><span class="sh">"</span><span class="p">,</span>
    <span class="n">right_on</span><span class="o">=</span><span class="sh">"</span><span class="s">hr_time</span><span class="sh">"</span><span class="p">,</span>
<span class="p">).</span><span class="nf">drop</span><span class="p">(</span><span class="n">columns</span><span class="o">=</span><span class="p">[</span><span class="sh">"</span><span class="s">FitbitTZ</span><span class="sh">"</span><span class="p">,</span> <span class="sh">"</span><span class="s">hr_time</span><span class="sh">"</span><span class="p">])</span> \
    <span class="p">.</span><span class="nf">sort_values</span><span class="p">(</span><span class="sh">'</span><span class="s">Time</span><span class="sh">'</span><span class="p">).</span><span class="nf">fillna</span><span class="p">(</span><span class="n">method</span><span class="o">=</span><span class="sh">'</span><span class="s">ffill</span><span class="sh">'</span><span class="p">)</span>
</code></pre></div></div>

<p>This gives us a table with all the information we need to create the entire activity. Shown with abbreviated column names and date for spacing:</p>

<div class="language-plaintext highlighter-rouge"><div class="highlight"><pre class="highlight"><code>              Alt          Lng         Lat             Time   hr
0      236.481536   -94.435942   39.236765   22:51:43+00:00   98
1      236.466522   -94.435941   39.236763   22:51:44+00:00   98
2      236.344946   -94.435940   39.236762   22:51:45+00:00   98
3      236.278519   -94.435938   39.236762   22:51:46+00:00   98
4      236.260699   -94.435933   39.236764   22:51:47+00:00   98
...           ...          ...         ...              ...  ...
4798   234.847334   -94.435919   39.236706   00:35:00+00:00  141
4799   234.841117   -94.435915   39.236708   00:35:01+00:00  141
4800   234.942241   -94.435913   39.236708   00:35:02+00:00  141
4801   234.961215   -94.435914   39.236708   00:35:03+00:00  141
4802   234.858422   -94.435909   39.236709   00:35:04+00:00  141
</code></pre></div></div>

<h1 id="formatting-for-upload">Formatting For Upload</h1>

<p>This is already a long enough article, so I’m going to keep this brief. Of the file formats available, I chose <a href="https://en.wikipedia.org/wiki/Training_Center_XML">Training Center XML (TCX)</a>, since it’s a fairly simple XML schema. Once I had the data, it was a matter of tracking down information on the TCX file format and copying it.</p>

<p>I accomplished this using <a href="https://docs.python.org/3/library/xml.etree.elementtree.html">ElementTree</a>, wrote it to a <a href="https://docs.python.org/3/library/io.html#io.BytesIO">BytesIO</a> object, then uploaded to Strava using <a href="https://requests.readthedocs.io/en/master/">requests</a>.</p>

<h1 id="success">Success!</h1>

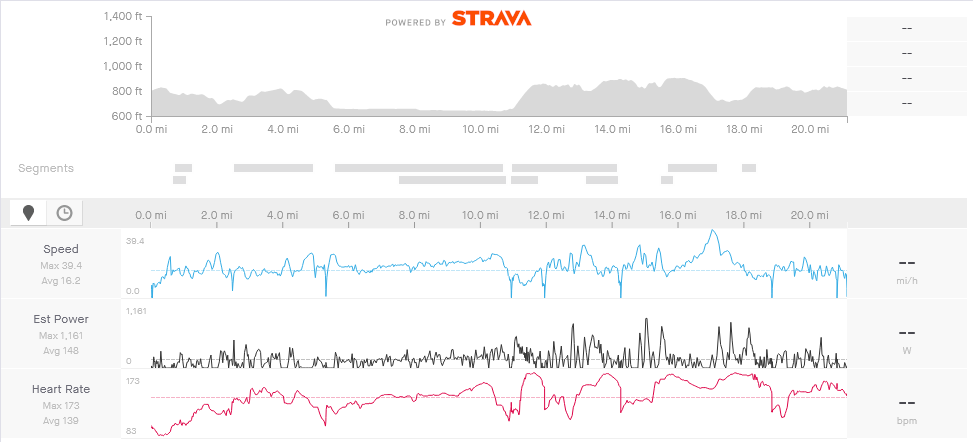
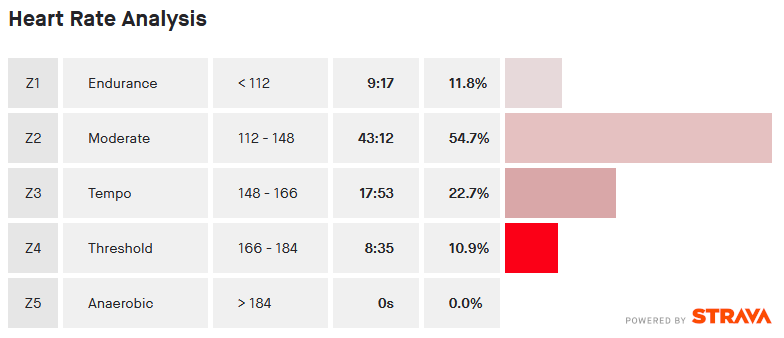
<p>A ride with heart rate data!</p>

<figure>
  <img src="/assets/images/2020/09/ride-w-heartrate.png" alt="" />
  <figcaption>Ride Analysis with Heart Rate</figcaption>
</figure>

<figure>
  <img src="/assets/images/2020/09/hr-analysis.png" alt="" />
  <figcaption>Heart Rate Analysis From Ride</figcaption>
</figure>

<h1 id="takeaways">Takeaways</h1>

<p>In general, most fitness apps function like walled gardens. Depending on how it’s tracked, it may be very difficult to get a complete picture of everything. As a data nerd, this is incredibly frustrating.</p>

<p>This was a fun problem to solve, as I got to punch a hole through some of these walls. I’ve been using this script for about a week without any issues. Unfortunately, I think it’s a bit of a temporary situation. There are a lot of moving pieces, and many different things could affect the data availability.</p>

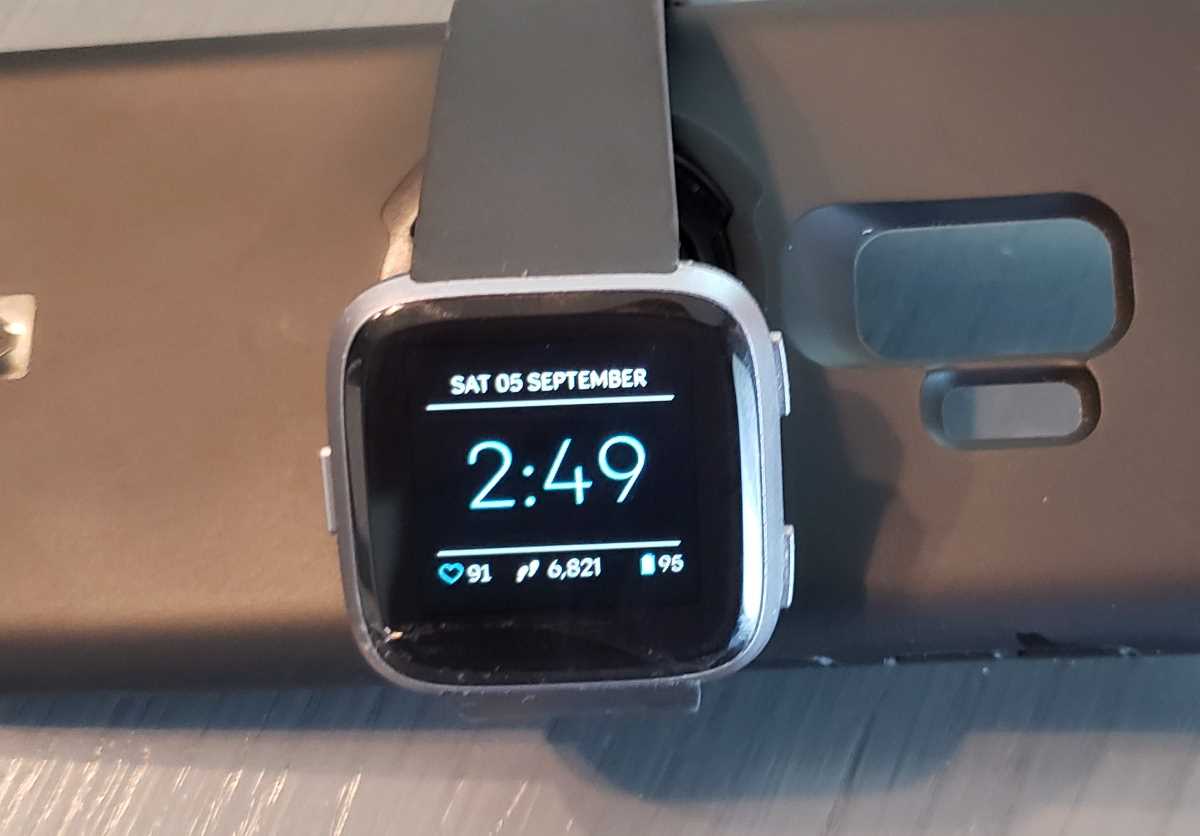
<p>As far as Fitbit, I honestly can’t recommend them for anything other than a casual step tracker. In 2018, I had the opportunity to pick up a Fitbit Versa through a former employer’s health plan, but found it to be lackluster in the smart watch capabilities and fragile. Disappointingly, the screen cracked in a minor tumble about a week after I got it. I really get nothing out of their health dashboard either, so I use it like a dumb watch that also records my heart rate.</p>

<figure>
  <img src="/assets/images/2020/09/versa-crack-web.jpg" alt="" />
  <figcaption>My cracked Fitbit Versa</figcaption>
</figure>

<p>I actually plan on buying into a device ecosystem that already has everything I need all in one place. So, essentially, I’ll be throwing money at the problem, but I think it’ll give me a much better experience. In the long run, it’ll be money well spent for my new favorite hobby.</p>]]></content><author><name>Ryan Veach</name></author><category term="Data" /><category term="Fitbit" /><category term="Fitness" /><category term="Pandas" /><category term="Python" /><category term="RideWithGPS" /><category term="Strava" /><summary type="html"><![CDATA[About a year ago, I got into cycling. Naturally, since I’m a bit of a data nerd, I started tracking my rides, so I could keep track of my progress. For the unaware, cycling can be a pretty expensive hobby, so in starting out, I chose to use my phone for GPS tracking using Strava and RideWithGPS. I honestly had no complaints, until I wanted to add in my heart rate….]]></summary></entry><entry><title type="html">Automated Config Management</title><link href="https://ryanveach.com/2020/02/08/automated-config-management/" rel="alternate" type="text/html" title="Automated Config Management" /><published>2020-02-08T13:33:01-06:00</published><updated>2020-02-08T13:33:01-06:00</updated><id>https://ryanveach.com/2020/02/08/automated-config-management</id><content type="html" xml:base="https://ryanveach.com/2020/02/08/automated-config-management/"><![CDATA[<p>I am certainly a technology enthusiast. My home is littered with computers and other electronic devices. Unfortunately, these often require attention, because neglected devices lead to problems. Doing this manually would quickly turn into hours of tedious inspection, configuration, and documentation, and that sound super boring. I’ve used <a href="https://docs.ansible.com/">Ansible</a> for many years to do this at home, and it’s about time I wrote up how I use it.</p>

<figure class="media-text align-right">
  <img src="/assets/images/2020/02/ansible-term.png" alt="" />
</figure>

<p><a href="https://docs.ansible.com/">Ansible</a> is free and open source configuration management software, powered by Python, ssh, and YAML. The core is simple, but powerful. Unless you shell out some cash for Tower, it’s still manual.</p>

<hr />

<h3 id="my-solution">My Solution</h3>

<p>Enter <strong>ansible-docker</strong>, an image I created for automated Ansible execution using <a href="https://about.gitlab.com/stages-devops-lifecycle/continuous-integration/">GitLab CI</a>.</p>

<ul>
  <li>Docker Hub <a href="https://hub.docker.com/r/rveach/ansible">rveach/ansible</a></li>
  <li>GitLab Source: <a href="https://gitlab.com/rveach/ansible-docker/">rveach/ansible-docker</a></li>
</ul>

<p>While you can pull it and run it interactively, it’s really meant for use in CI/CD environments. To use it, just create a separate repo, and structure it in this manner. The integration takes place in the .gitlab-ci.yml file.</p>

<div class="language-plaintext highlighter-rouge"><div class="highlight"><pre class="highlight"><code>playbooks/             # pull all ansible playbook stuff here
    site.yml           # or any other file
    group_vars/        # with group_vars and roles
    roles/             # just do whatever you've configured
                       # follow standard ansible best practices

ssh/                   # ssh info
    id_rsa             # private key
    id_rsa.pub         # keep the public key here too
    known_hosts        # known hosts file
    config             # ssh config file

hosts                  # hosts file
ansible.cfg            # ansible.cfg file
.gitlab-ci-yml         # define CI jobs here
</code></pre></div></div>

<h3 id="ssh-security">SSH Security</h3>

<p>When performing configuration management over SSH, the remote user must be either privileged or have the ability to perform critical tasks as a privileged user. This is not to be taken lightly. In my environments, I do not allow SSH in through my firewall. Instead, I’ve <a href="https://docs.gitlab.com/runner/install/">installed a GitLab runner</a> behind my firewalls in each location.</p>

<p>In addition to network security, this image allows you to include your own ssh keys, known_hosts file and ssh config file.</p>

<ul>
  <li>The private key file name will default to id_rsa, but can be overridden with the environment variable <code class="language-plaintext highlighter-rouge">$SSH_KEY_NAME</code>.</li>
  <li>The private key file can be password protected, just supply the environment variable <code class="language-plaintext highlighter-rouge">$SSH_KEY_PASSPHRASE</code> to decrypt.</li>
  <li>The known_hosts file can be populated populated for each of your hosts using the output of <code class="language-plaintext highlighter-rouge">ssh-keyscan -H $REMOTE_HOST</code>. Alternatively, you can set <code class="language-plaintext highlighter-rouge">host_key_checking = False</code> in the ansible.cfg if you don’t care to validate host keys.</li>
  <li>…and of course, the ssh config file can be set up in any way necessary.</li>
</ul>

<p>You may want to look into other standard ways of securing SSH, like this one on nixCraft: <a href="https://www.cyberciti.biz/tips/linux-unix-bsd-openssh-server-best-practices.html">Top 20 OpenSSH Server Best Security Practices</a></p>

<h3 id="ansible-vault">Ansible Vault</h3>

<p>When using sensitive information in an Ansible playbook, it’s highly recommended to use <a href="https://docs.ansible.com/ansible/latest/user_guide/vault.html">Ansible Vault</a> to encrypt those contents. The wrapper script has functionality to read a vault password from either the environment variable <code class="language-plaintext highlighter-rouge">$VAULT_PASSWORD</code> (recommended) or the command line argument <code class="language-plaintext highlighter-rouge">--vault-password</code>(not recommended for security reasons).</p>

<h4 id="home-servers">Home Servers</h4>

<div class="language-yaml highlighter-rouge"><div class="highlight"><pre class="highlight"><code><span class="na">deploy-homeservers</span><span class="pi">:</span>
  <span class="na">stage</span><span class="pi">:</span> <span class="s">deploy</span>
  <span class="na">image</span><span class="pi">:</span> <span class="s">rveach/ansible:latest-arm</span>
  <span class="na">script</span><span class="pi">:</span>
    <span class="pi">-</span> <span class="s">/usr/local/bin/run.py --playbooks site_homeservers.yml</span>
  <span class="na">only</span><span class="pi">:</span>
    <span class="pi">-</span> <span class="s">master</span>
    <span class="pi">-</span> <span class="s">homeservers</span>
  <span class="na">except</span><span class="pi">:</span>
    <span class="na">variables</span><span class="pi">:</span>
      <span class="pi">-</span> <span class="s">$ANSIBLE_PLAYBOOK_LIST</span>
  <span class="na">tags</span><span class="pi">:</span>
      <span class="pi">-</span> <span class="s">armhf</span>
      <span class="pi">-</span> <span class="s">homelab</span>
</code></pre></div></div>

<h4 id="digital-ocean-droplets">Digital Ocean Droplets</h4>

<div class="language-yaml highlighter-rouge"><div class="highlight"><pre class="highlight"><code><span class="na">deploy-droplets</span><span class="pi">:</span>
  <span class="na">stage</span><span class="pi">:</span> <span class="s">deploy</span>
  <span class="na">image</span><span class="pi">:</span> <span class="s">rveach/ansible:latest</span>
  <span class="na">script</span><span class="pi">:</span>
    <span class="pi">-</span> <span class="s">/usr/local/bin/run.py --playbooks site_droplets.yml</span>
  <span class="na">only</span><span class="pi">:</span>
    <span class="pi">-</span> <span class="s">master</span>
    <span class="pi">-</span> <span class="s">droplets</span>
  <span class="na">except</span><span class="pi">:</span>
    <span class="na">variables</span><span class="pi">:</span>
      <span class="pi">-</span> <span class="s">$ANSIBLE_PLAYBOOK_LIST</span>
  <span class="na">tags</span><span class="pi">:</span>
    <span class="pi">-</span> <span class="s">droplet</span>
</code></pre></div></div>

<h4 id="dynamic-deploy">Dynamic Deploy</h4>

<div class="language-yaml highlighter-rouge"><div class="highlight"><pre class="highlight"><code><span class="na">deploy-dynamic</span><span class="pi">:</span>
  <span class="na">stage</span><span class="pi">:</span> <span class="s">deploy</span>
  <span class="na">image</span><span class="pi">:</span> <span class="s">rveach/ansible:latest-arm</span>
  <span class="na">script</span><span class="pi">:</span>
    <span class="pi">-</span> <span class="s">/usr/local/bin/run.py --playbooks ${ANSIBLE_PLAYBOOK_LIST}</span>
  <span class="na">only</span><span class="pi">:</span>
    <span class="pi">-</span> <span class="s">master</span>
  <span class="na">except</span><span class="pi">:</span>
    <span class="na">variables</span><span class="pi">:</span>
      <span class="pi">-</span> <span class="s">$ANSIBLE_PLAYBOOK_LIST == </span><span class="kc">null</span>
  <span class="na">tags</span><span class="pi">:</span>
      <span class="pi">-</span> <span class="s">armhf</span>
      <span class="pi">-</span> <span class="s">homelab</span>
</code></pre></div></div>

<p>These jobs provide flexibility in a few ways:</p>

<ul>
  <li>Deploy Dynamic is executed when a playbook list is passed through an optional variable. This is mainly used when triggering CI tasks from other projects via the external API.</li>
  <li>The other tasks run for master, but can also be set up to run from other branches. I use this to speed up the feedback loop when actively working on a role.</li>
  <li><strong>Note:</strong> I’m also pulling two different tags for the image. Until I spend some time to configure a multi-arch build, separate tags are needed for amd64 and arm. I just happen to use a dedicated Raspberry Pi 3B+ for my GitLab Runner at home.</li>
</ul>

<hr />

<h3 id="in-use">In Use:</h3>

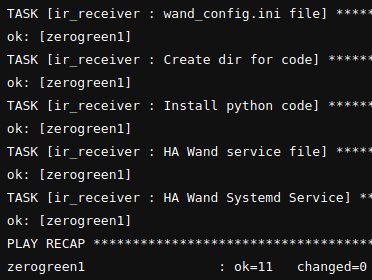
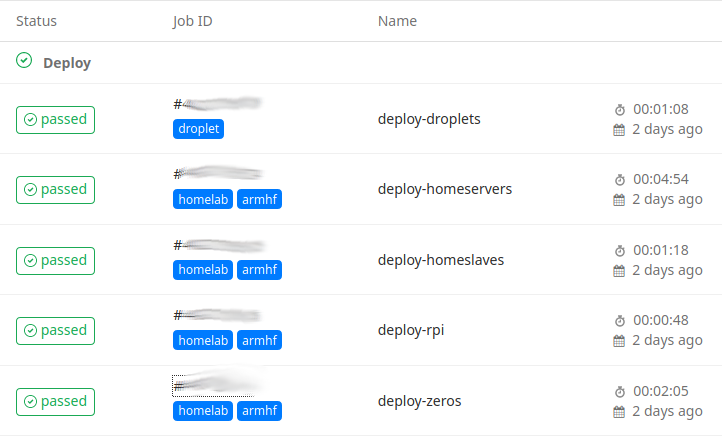
<p>Now, whenever I push to the repo, I know that Ansible will execute, and I rely on GitLab’s notifications to let me know when there has been a failure.</p>

<figure>
  <img src="/assets/images/2020/02/gitlab-jobs.png" alt="" />
  <figcaption>Individual jobs in a Pipeline</figcaption>
</figure>

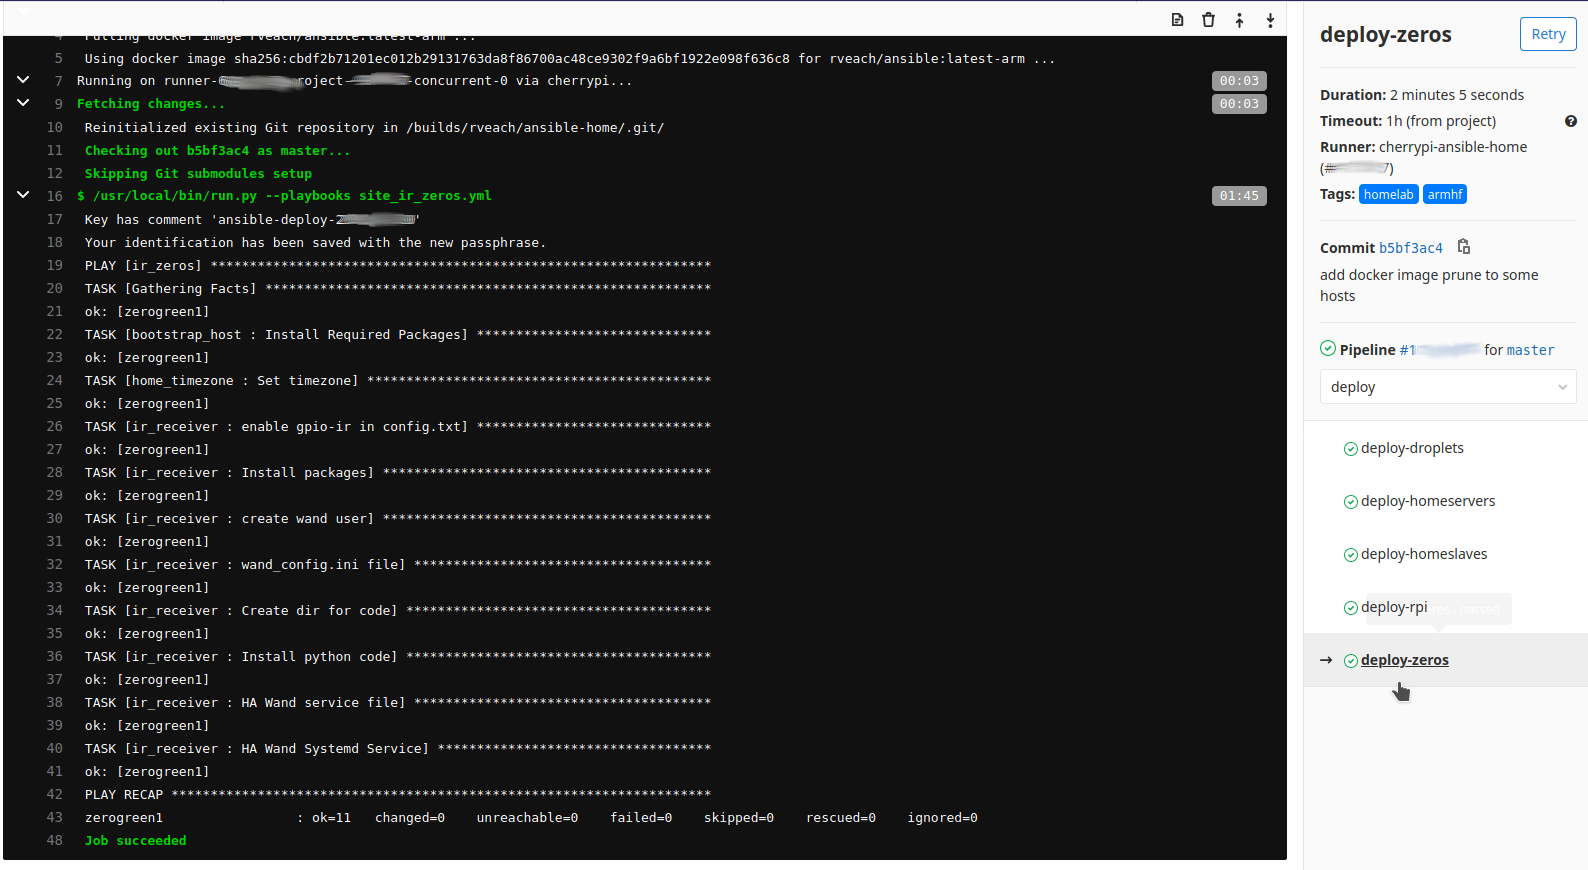
<p>Should any individual job fail, the log is also available:</p>

<figure>
  <img src="/assets/images/2020/02/ci-task-view.png" alt="" />
  <figcaption>Ansible Log in CI job view</figcaption>
</figure>

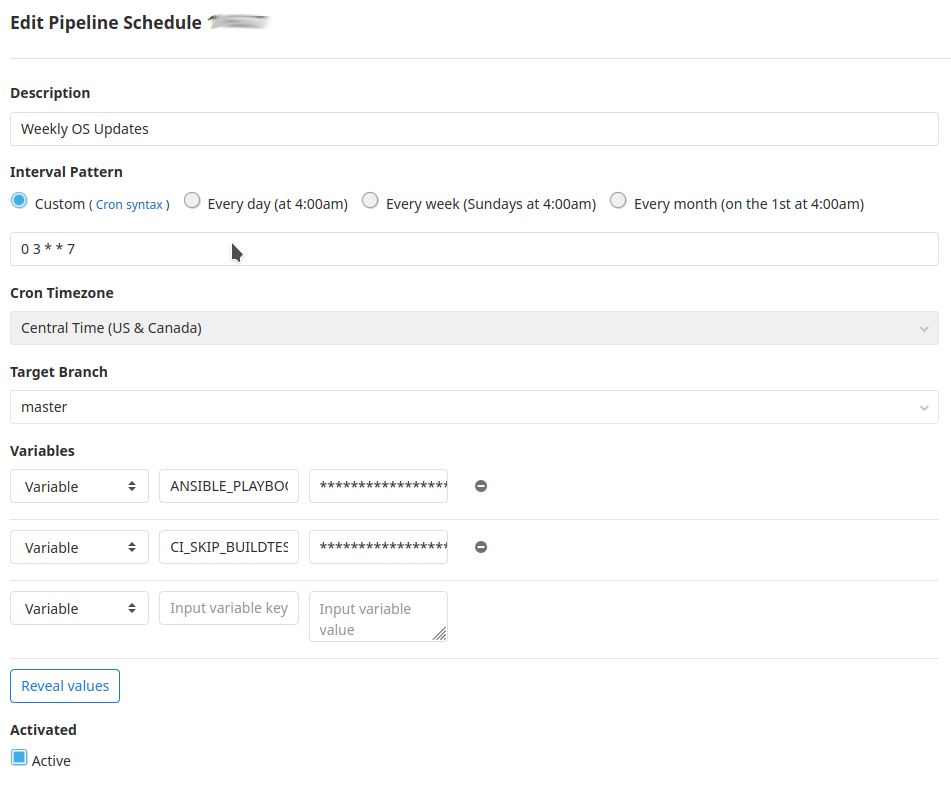
<h3 id="scheduling-jobs">Scheduling Jobs</h3>

<p>Of course, updates on repo push is only half the story. Any well managed environment should have configuration deployed on a schedule to automate updates and prevent configuration drift. Luckily, <a href="https://gitlab.com/help/user/project/pipelines/schedules">GitLab CI allows you to schedule pipelines</a>.</p>

<figure>
  <img src="/assets/images/2020/02/pipeline-schedule.png" alt="" />
  <figcaption>Scheduled Pipelines</figcaption>
</figure>

<figure>
  <img src="/assets/images/2020/02/edit-pipeline.png" alt="" />
  <figcaption>Editing Pipeline Schedules</figcaption>
</figure>

<hr />

<p>In conclusion, it took me a bit of time to work out all the kinks on this, but once completed, it’s been incredibly smooth. In writing this, I hope others can benefit from my work or find inspiration to create their own solution.</p>

<hr />

<p><a style="background-color:black;color:white;text-decoration:none;padding:4px 6px;font-family:-apple-system, BlinkMacSystemFont, &quot;San Francisco&quot;, &quot;Helvetica Neue&quot;, Helvetica, Ubuntu, Roboto, Noto, &quot;Segoe UI&quot;, Arial, sans-serif;font-size:12px;font-weight:bold;line-height:1.2;display:inline-block;border-radius:3px" href="https://unsplash.com/@hbtography?utm_medium=referral&amp;utm_campaign=photographer-credit&amp;utm_content=creditBadge" target="_blank" rel="noopener noreferrer" title="Download free do whatever you want high-resolution photos from Harrison Broadbent"><span style="display:inline-block;padding:2px 3px"><svg xmlns="http://www.w3.org/2000/svg" style="height:12px;width:auto;position:relative;vertical-align:middle;top:-2px;fill:white" viewBox="0 0 32 32"><title>unsplash-logo</title><path d="M10 9V0h12v9H10zm12 5h10v18H0V14h10v9h12v-9z"></path></svg></span><span style="display:inline-block;padding:2px 3px">Cover image by Harrison Broadbent</span></a></p>]]></content><author><name>Ryan Veach</name></author><category term="Homelab" /><category term="Ansible" /><category term="CI/CD" /><category term="GitLab" /><summary type="html"><![CDATA[I am certainly a technology enthusiast. My home is littered with computers and other electronic devices. Unfortunately, these often require attention, because neglected devices lead to problems. Doing this manually would quickly turn into hours of tedious inspection, configuration, and documentation, and that sound super boring. I’ve used Ansible for many years to do this at home, and it’s about time I wrote up how I use it.]]></summary></entry><entry><title type="html">Alert for Open Garage Door</title><link href="https://ryanveach.com/2020/01/13/alert-for-open-garage-door/" rel="alternate" type="text/html" title="Alert for Open Garage Door" /><published>2020-01-13T17:44:00-06:00</published><updated>2020-01-13T17:44:00-06:00</updated><id>https://ryanveach.com/2020/01/13/alert-for-open-garage-door</id><content type="html" xml:base="https://ryanveach.com/2020/01/13/alert-for-open-garage-door/"><![CDATA[<p>In my area, there have been many recent reports of thieves driving through neighborhoods. They have been peeking in garages and trying car door handles, looking for easy items to steal. In most situations, it looks like closed garage doors and locked cars are left alone.</p>

<p>I’ve personally set up an alert, so my phone is notified after my garage door has been left open for a certain amount of time. This helps me sleep better, and a recent event at a friends house has spurred me to share the knowledge. While there are <em>many</em> ways to do this, I will detail two methods.</p>

<p>Note that many systems, including the two listed below are capable of much more. They can even be made to shut the door automatically. Personally, if my house is going to think for itself, I prefer it lets me know what it thinks vs acting on it’s own. Be mindful, <a href="https://en.wikipedia.org/wiki/Alarm_fatigue">Alarm Fatigue</a> is a real thing! Try to minimize the number of false alarms based on your own lifestyle and habits.</p>

<h2 id="myq-garage-door-alerts">MyQ Garage Door Alerts</h2>

<p>Many recent Liftmaster and Chamberlain garage door openers come with <a href="https://www.myq.com/">MyQ technology</a> enabled. These openers connect via WiFi, and can be controlled via a mobile app. Without needing too much technical expertise, these can be enabled and actively monitored all with the MyQ app.</p>

<p>I’m using MyQ, because the openers that came with my house had this available. They’re an excellent option for most people, but they do rely on a cloud system, which may bother some people. The following guide assumes that the app is already installed and the opener is connected.</p>

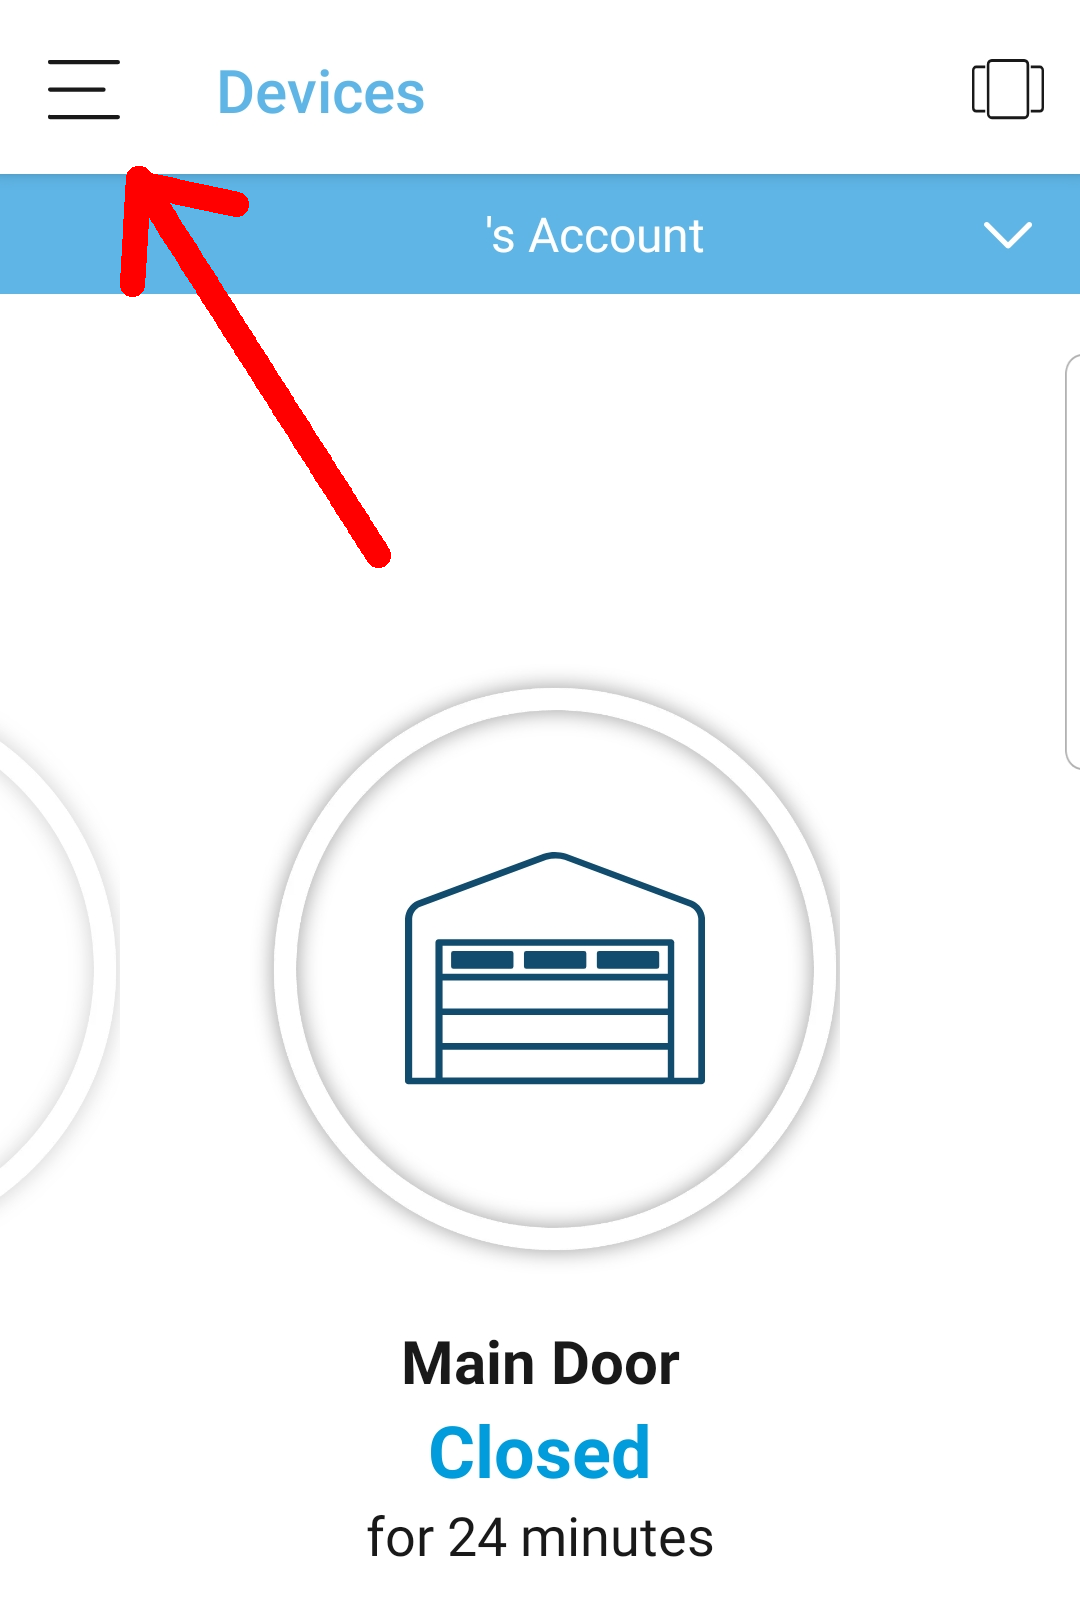
<figure class="media-text align-right">
  <img src="/assets/images/2020/01/myq_ss1_show_menu.png" alt="location of the myq menu button" />
</figure>

<ol>
  <li>Open up the app and select the menu button</li>
</ol>

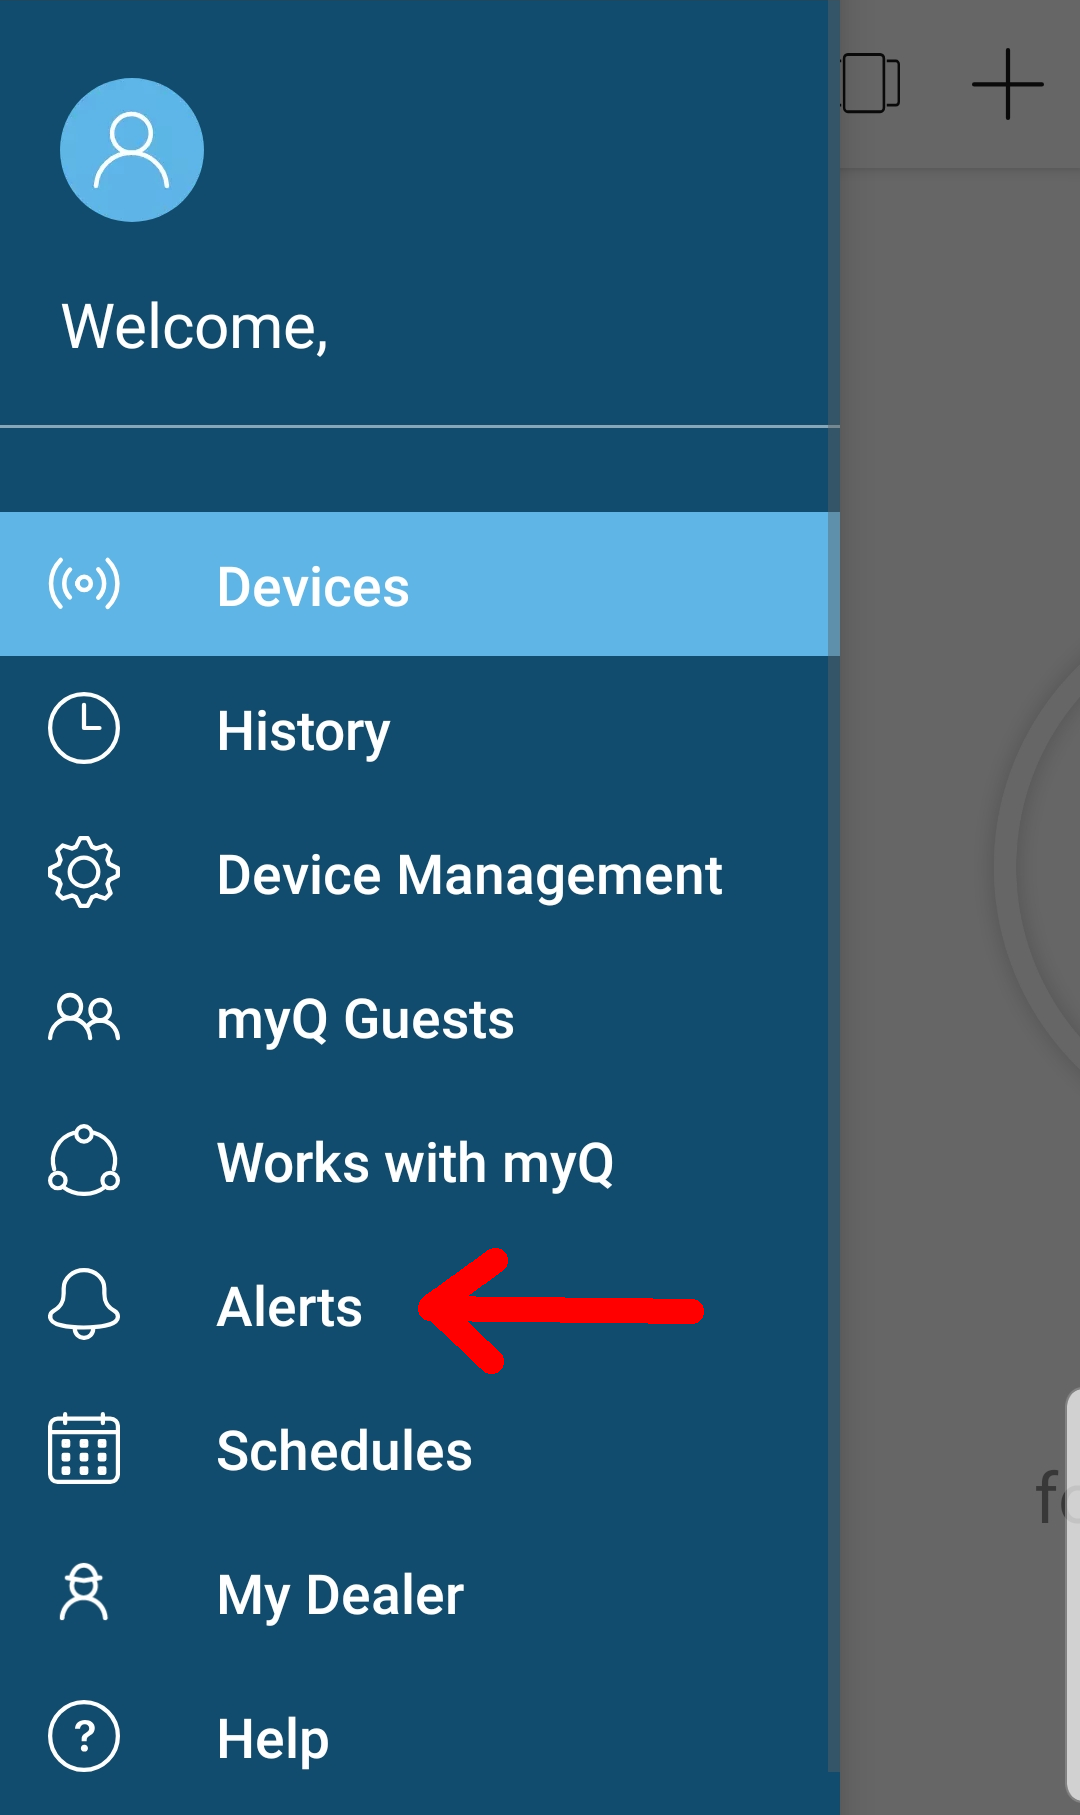
<figure class="media-text align-right">
  <img src="/assets/images/2020/01/myq_ss2_show_alerts.png" alt="myq menu, select alerts" />
</figure>

<p>2. In the MyQ app menu, select Alerts.</p>

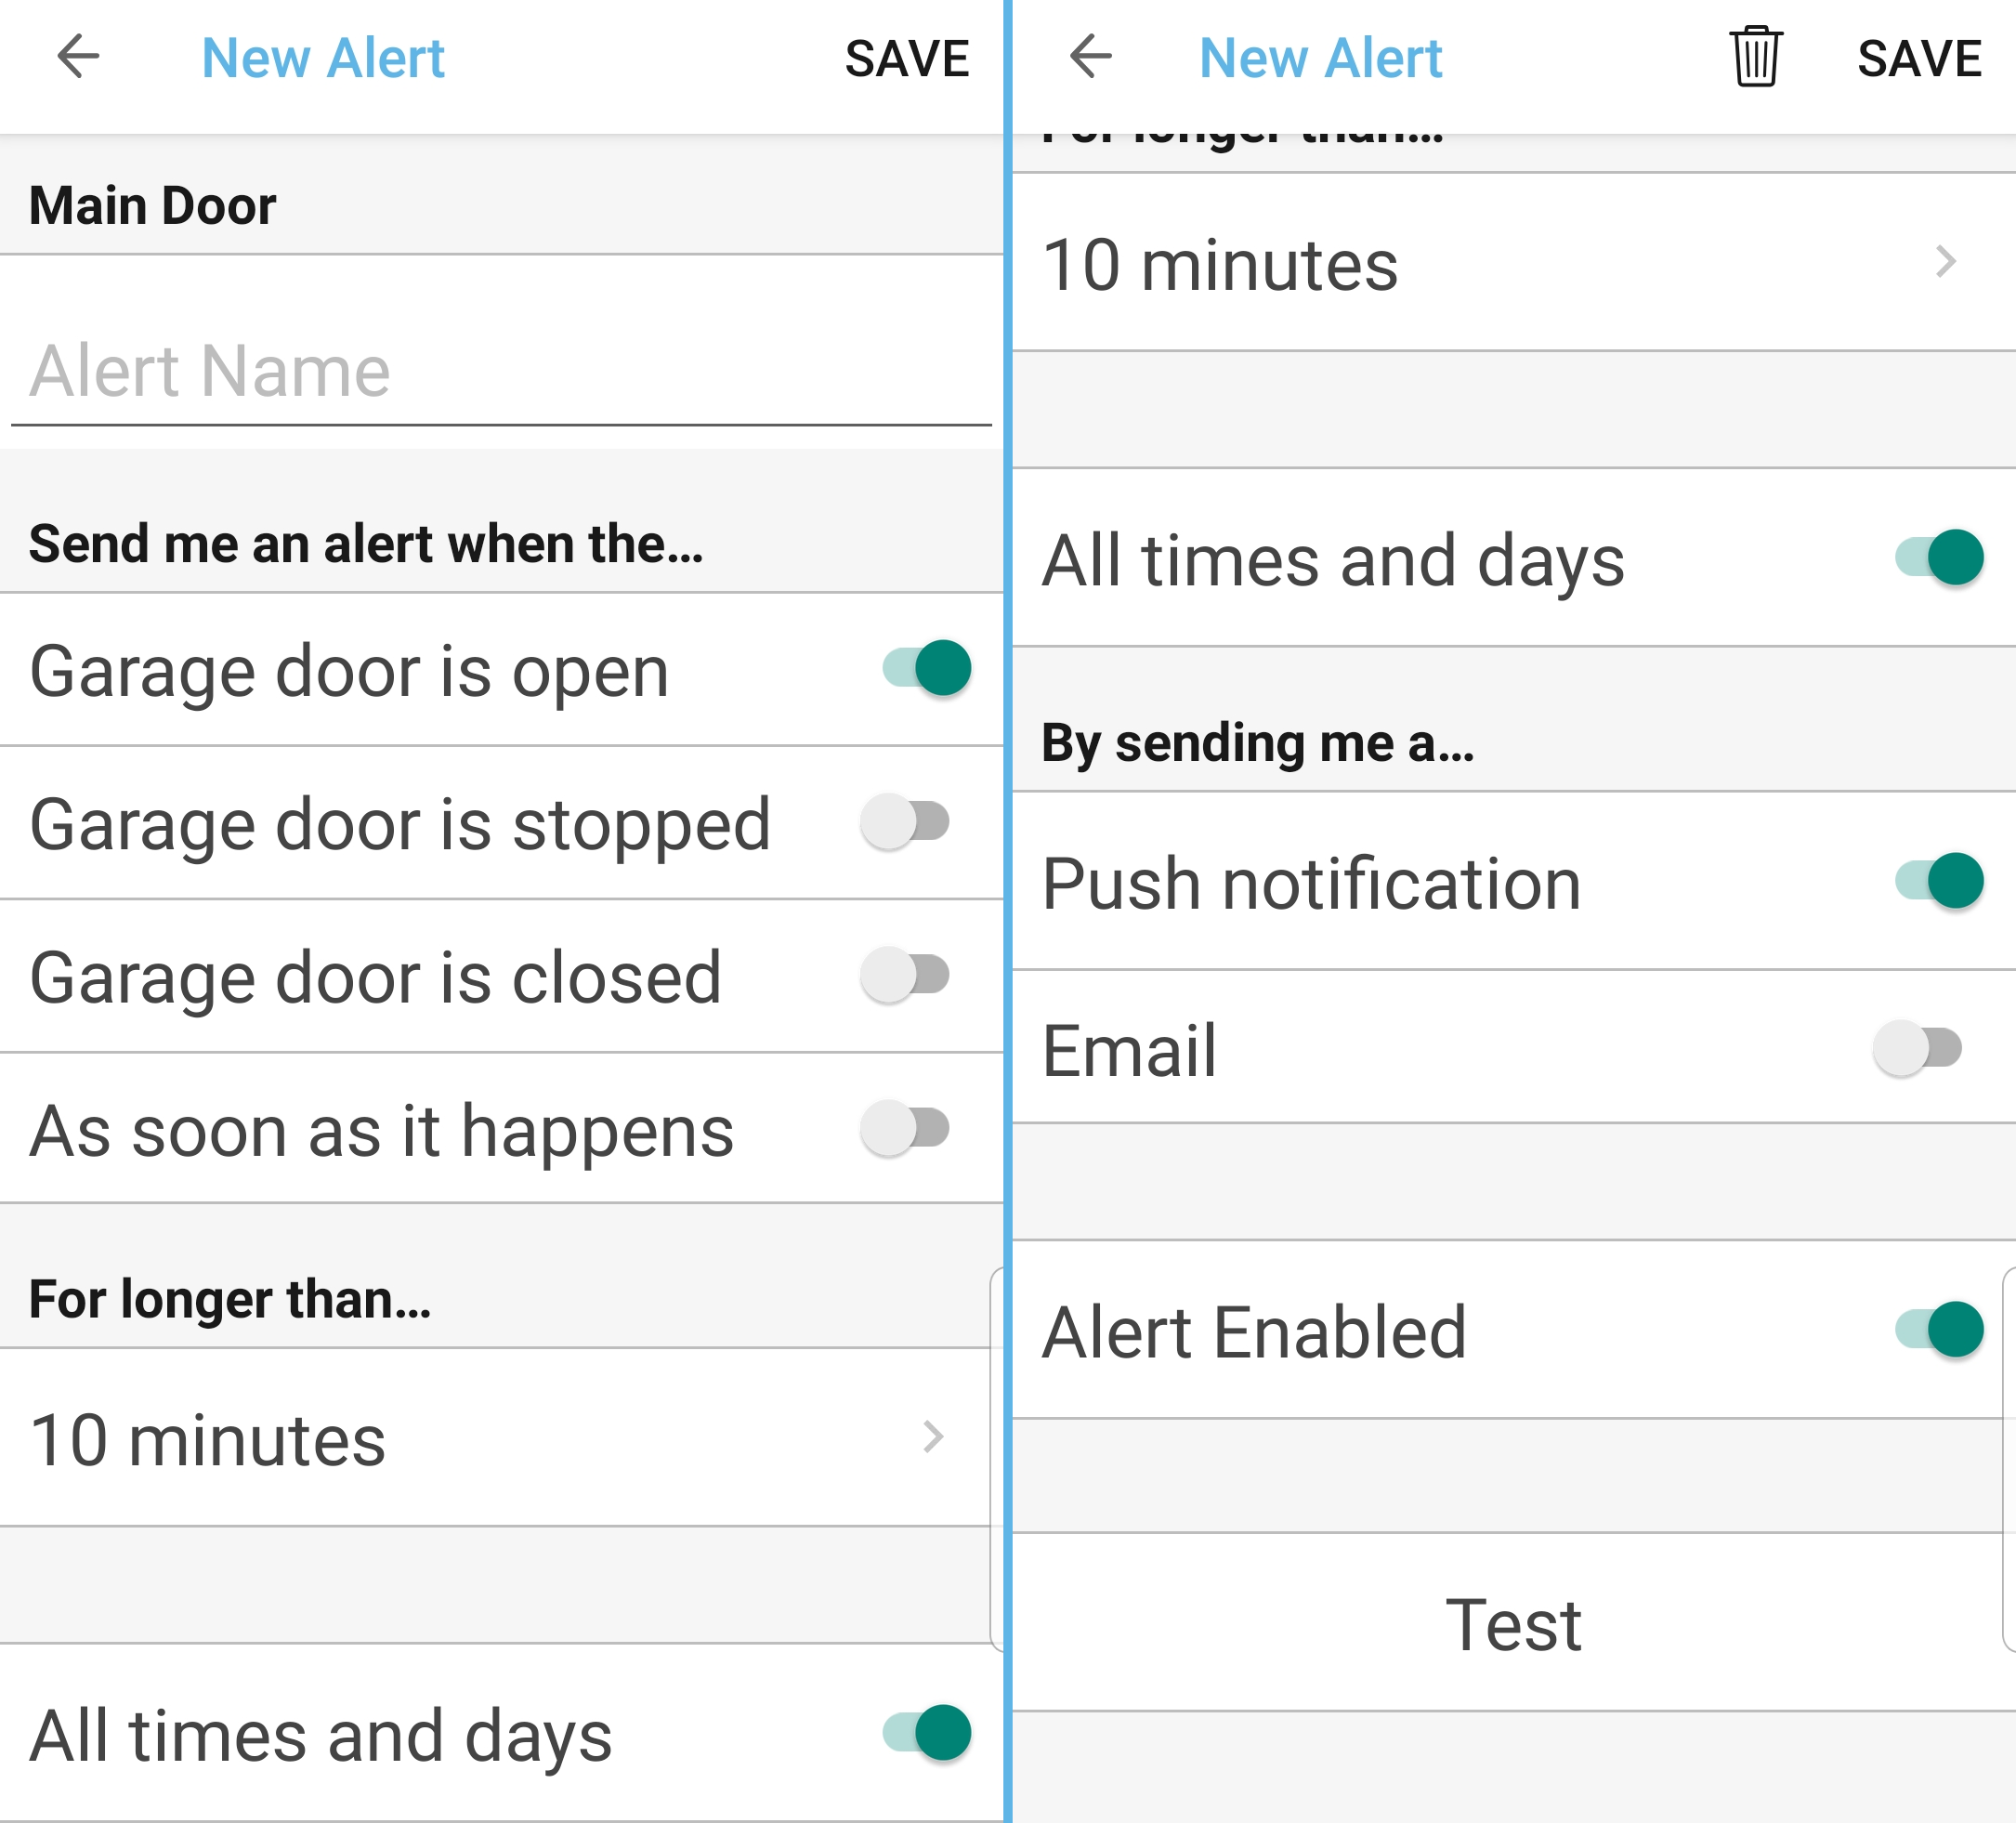
<figure class="media-text align-right">
  <img src="/assets/images/2020/01/myq_ss3_show_alert_options.png" alt="myq alert rule definition" />
</figure>

<p>3. You should then be able to create a new alert. To do this</p>

<ul>
  <li>Give the alert a name</li>
  <li>Sent me an alert when the: Garage door is open</li>
  <li>For longer than: Set the desired time frame here</li>
  <li>By default, this will be enabled all times and days.</li>
  <li>By default, alerts are sent via push notification to the app, but can also be sent via email.</li>
  <li>By default, the alert is enabled. This option allows you to disable the alert.</li>
</ul>

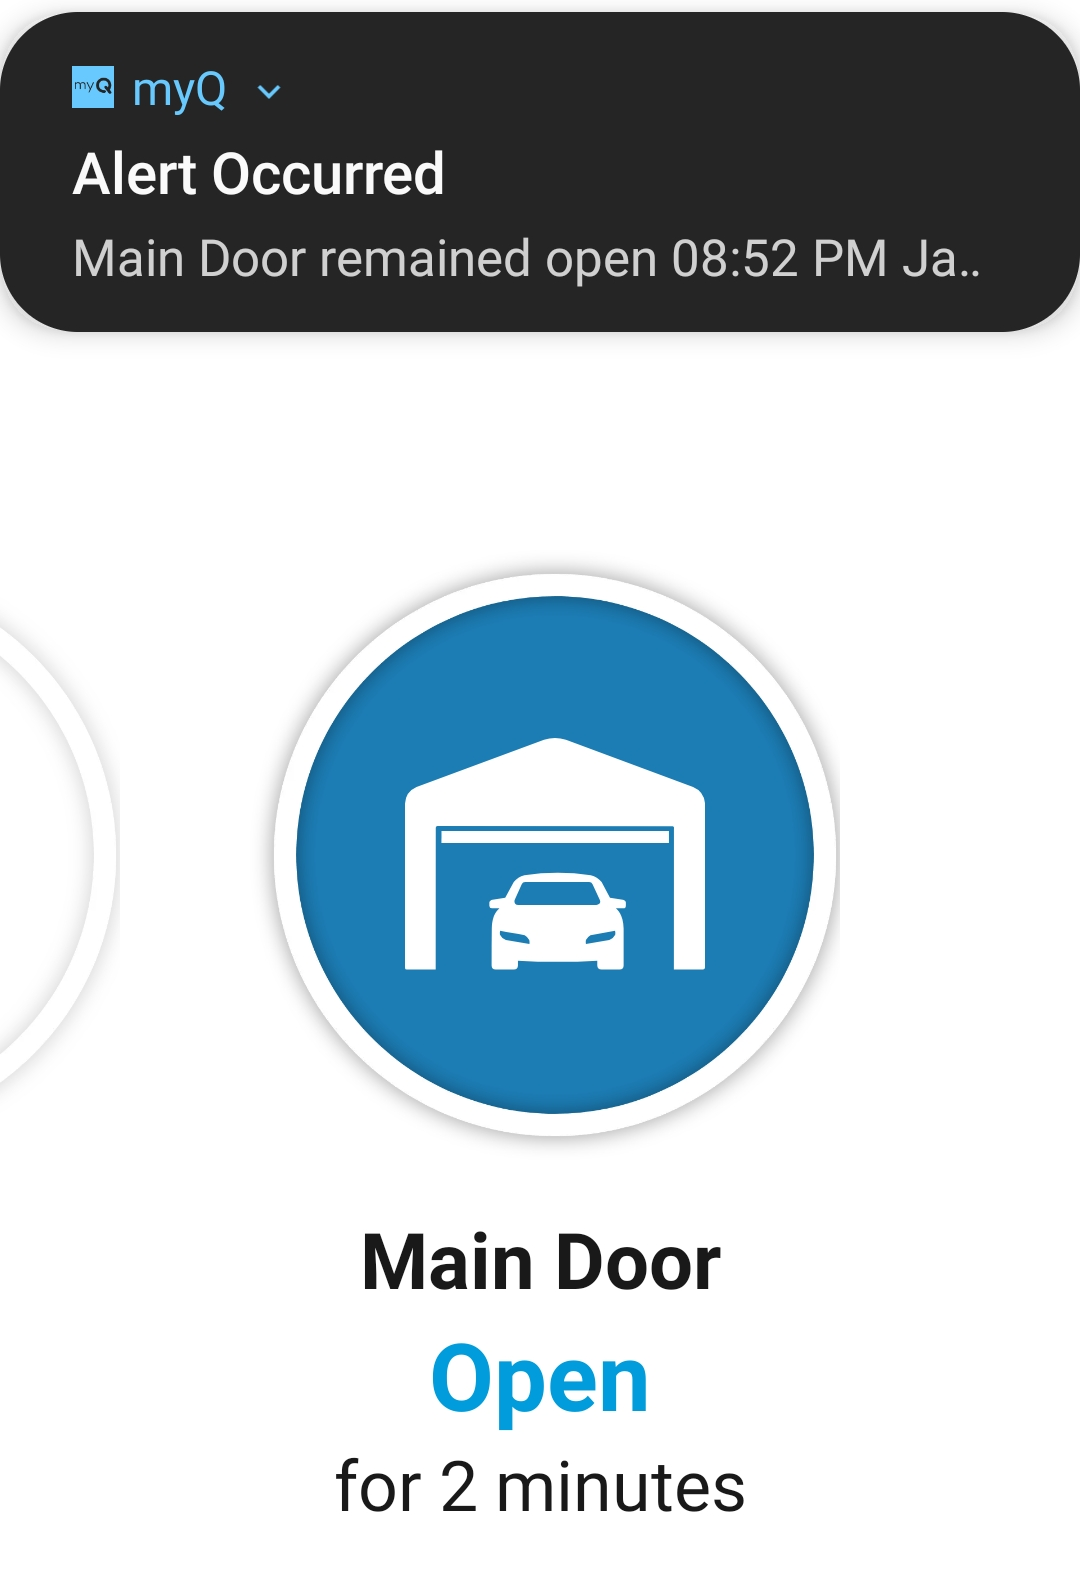
<figure class="media-text align-right">
  <img src="/assets/images/2020/01/myq_ss4_bingo.png" alt="myq notification picture" />
</figure>

<p>4. Test the alert!</p>

<ul>
  <li>Just open up the door, and make sure you get an alert.</li>
  <li>Note: at the time of writing, it was <em>very</em> cold outside, so the alert as tested was set to only 2 minutes. The app should respect the value set in step 3.</li>
</ul>

<h2 id="home-assistant-garage-door-alerts">Home Assistant Garage Door Alerts</h2>

<p>Home automation is a fairly recent hobby of mine, and I’ve chosen <a href="https://www.home-assistant.io/">Home Assistant</a> as my main hub. Unlike most home hubs, it is software only and can be installed on most computers or single board computers, such as a Raspberry Pi. It is configured mainly using yaml based files, but the development team has been working a config model that allows everything to be completed via the web frontend.</p>

<p>To start with the install, it is best to ensure that some common entities are enabled as well as the myq cover. We can also add our notifier here. There are many examples, but my example shows <a href="https://pushover.net/">Pushover</a>.</p>

<div class="language-yaml highlighter-rouge"><div class="highlight"><pre class="highlight"><code><span class="nn">---</span>
<span class="c1"># the following 4 items are enabled for config and troubleshooting</span>
<span class="na">config</span><span class="pi">:</span>
<span class="na">frontend</span><span class="pi">:</span>
<span class="na">logbook</span><span class="pi">:</span>
<span class="na">system_health</span><span class="pi">:</span>

<span class="c1"># enable myq as a cover.</span>
<span class="c1"># this example accepts the username and password as</span>
<span class="c1"># environment variables.</span>
<span class="na">cover</span><span class="pi">:</span>
  <span class="pi">-</span> <span class="na">platform</span><span class="pi">:</span> <span class="s">myq</span>
    <span class="na">username</span><span class="pi">:</span> <span class="kt">!env_var</span> <span class="s">MYQ_USERNAME</span>
    <span class="na">password</span><span class="pi">:</span> <span class="kt">!env_var</span> <span class="s">MYQ_PASSWORD</span>
    <span class="na">type</span><span class="pi">:</span> <span class="s">liftmaster</span>

<span class="c1"># configure a notifier</span>
<span class="c1"># this example shows pushover, by any one of many can be used.</span>
<span class="na">notify</span><span class="pi">:</span>
  <span class="pi">-</span> <span class="na">name</span><span class="pi">:</span> <span class="s">ryan_pushover</span>
    <span class="na">platform</span><span class="pi">:</span> <span class="s">pushover</span>
    <span class="na">api_key</span><span class="pi">:</span> <span class="kt">!env_var</span> <span class="s">PO_API_KEY</span>
    <span class="na">user_key</span><span class="pi">:</span> <span class="kt">!env_var</span> <span class="s">PO_USER_KEY</span>
</code></pre></div></div>

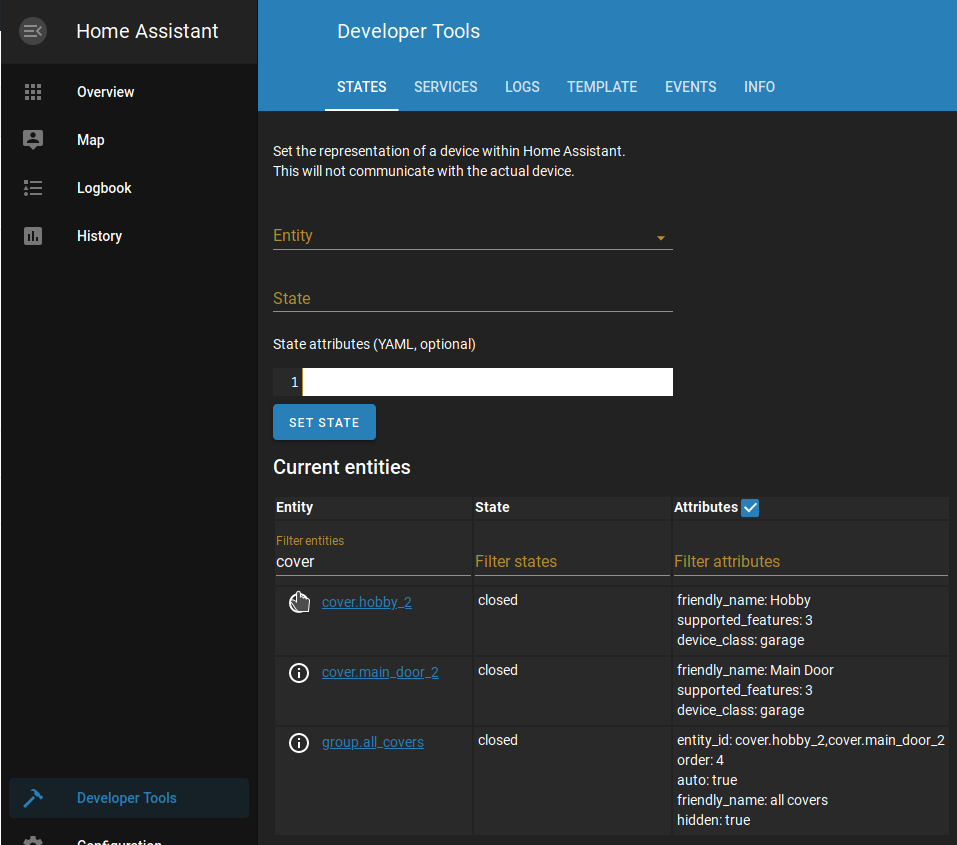
<p>Once enabled, restart Home Assistant and navigate to Developer Tools, States, then find the cover entries. In my case,</p>

<figure class="media-text align-right">
  <img src="/assets/images/2020/01/Screenshot_20200113_012657.png" alt="" />
</figure>

<p>Once enabled:</p>

<ul>
  <li>Restart Home Assistant</li>
  <li>Navigate to Developer Tools, States</li>
  <li>Find the cover entries, and record the names.</li>
  <li>In this screenshot, I’ve recorded cover.hobby_2 and cover.main_door_2</li>
</ul>

<p>Once we have the entity names, open back up the configuration.yaml and add an alert the one below anywhere that makes sense:</p>

<div class="language-yaml highlighter-rouge"><div class="highlight"><pre class="highlight"><code><span class="na">alert</span><span class="pi">:</span>
  <span class="na">garage_door_open</span><span class="pi">:</span>
    <span class="na">name</span><span class="pi">:</span> <span class="s">garage_door_is_open</span>
    <span class="na">entity_id</span><span class="pi">:</span> <span class="s">cover.main_door_2</span>
    <span class="na">state</span><span class="pi">:</span> <span class="s1">'</span><span class="s">open'</span>
    <span class="na">repeat</span><span class="pi">:</span>
      <span class="pi">-</span> <span class="m">10</span>
      <span class="pi">-</span> <span class="m">60</span>
    <span class="na">can_acknowledge</span><span class="pi">:</span> <span class="kc">true</span>
    <span class="na">skip_first</span><span class="pi">:</span> <span class="kc">true</span>
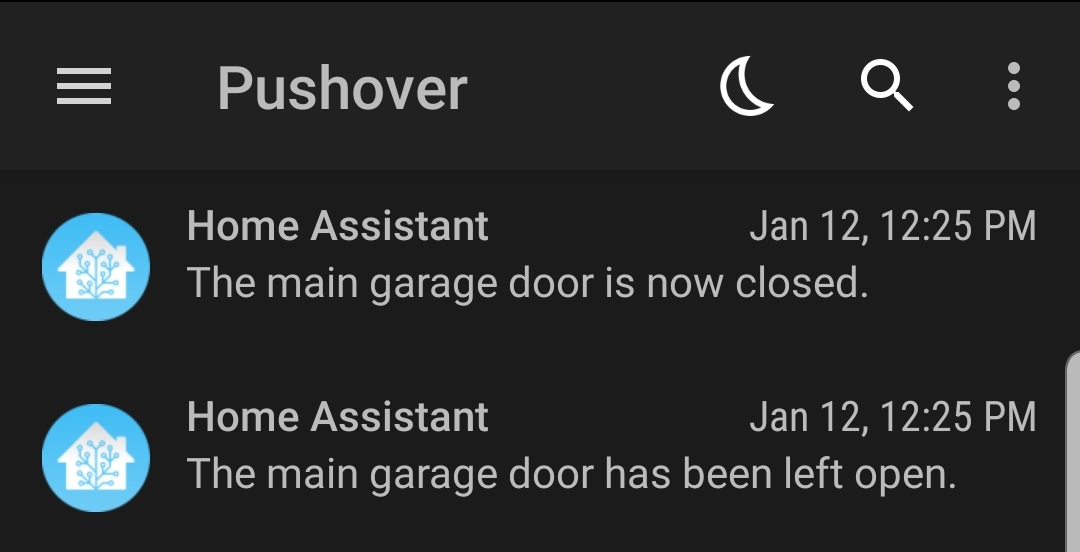
    <span class="na">message</span><span class="pi">:</span> <span class="s2">"</span><span class="s">The</span><span class="nv"> </span><span class="s">main</span><span class="nv"> </span><span class="s">garage</span><span class="nv"> </span><span class="s">door</span><span class="nv"> </span><span class="s">has</span><span class="nv"> </span><span class="s">been</span><span class="nv"> </span><span class="s">left</span><span class="nv"> </span><span class="s">open."</span>
    <span class="na">done_message</span><span class="pi">:</span> <span class="s2">"</span><span class="s">The</span><span class="nv"> </span><span class="s">main</span><span class="nv"> </span><span class="s">garage</span><span class="nv"> </span><span class="s">door</span><span class="nv"> </span><span class="s">is</span><span class="nv"> </span><span class="s">now</span><span class="nv"> </span><span class="s">closed."</span>
    <span class="na">notifiers</span><span class="pi">:</span>
      <span class="pi">-</span> <span class="s">ryan_pushover</span>
</code></pre></div></div>

<p>This config will do the following:</p>

<ul>
  <li>Monitor the entity cover.main_door_2, triggering off the ‘open’ state.</li>
  <li>It will alert at 10 minutes, then every 60 minutes after that.</li>
  <li>It can be acknowledged</li>
  <li>Skip first prevents an alert from being sent on initial open and only begins to send messages at 10 minutes.</li>
  <li>Messages to be sent on alert and resolution are defined.</li>
  <li>This will notify the pushover notifier configured above.</li>
</ul>

<figure class="media-text align-left">
  <img src="/assets/images/2020/01/Screenshot_20200113-014027_Pushover.jpg" alt="" />
</figure>

<p>Next, test the alert by leaving the garage door open.</p>

<p>Bingo! We have success!</p>

<hr />

<p>Cover Photo by <a href="https://unsplash.com/@vivintsolar?utm_source=unsplash&amp;utm_medium=referral&amp;utm_content=creditCopyText">Vivint Solar</a> on <a href="https://unsplash.com/s/photos/garage?utm_source=unsplash&amp;utm_medium=referral&amp;utm_content=creditCopyText">Unsplash</a></p>]]></content><author><name>Ryan Veach</name></author><category term="Home Automation" /><category term="Home Assistant" /><category term="Home Automation" /><category term="Home Security" /><category term="MyQ" /><category term="Pushover" /><summary type="html"><![CDATA[In my area, there have been many recent reports of thieves driving through neighborhoods. They have been peeking in garages and trying car door handles, looking for easy items to steal. In most situations, it looks like closed garage doors and locked cars are left alone.]]></summary></entry><entry><title type="html">….and we’re back</title><link href="https://ryanveach.com/2019/10/10/and-were-back/" rel="alternate" type="text/html" title="….and we’re back" /><published>2019-10-10T18:56:20-05:00</published><updated>2019-10-10T18:56:20-05:00</updated><id>https://ryanveach.com/2019/10/10/and-were-back</id><content type="html" xml:base="https://ryanveach.com/2019/10/10/and-were-back/"><![CDATA[<p>For anybody following along, this site has been down for a few months.</p>

<p>If you’ve been following along <em>really</em> closely, you might have noticed a few extra spammy blog posts showed up.</p>

<h2 id="i-got-hacked-_ツ_">I got hacked ¯\_(ツ)_/¯</h2>

<p>This blog has never been super critical, and admittedly, I was lax on security precautions, so I can’t say I’m super surprised. I wanted to understand the problem and come back with a better solution, so I powered off the VM, conducted an investigation, built out some Ansible roles for a new one, and I’m back up and running finally, whew!</p>

<h2 id="what-i-know">What I know:</h2>

<p>There was no unauthorized shell access to my web server. All access was obtained through exploiting the web application (WordPress).</p>

<p>Attackers likely gained access through uploading malicious PHP code, but I’m not going to rule out brute force attacks either.</p>

<h2 id="preventing-future-attacks">Preventing Future attacks:</h2>

<p>I’m not going to spell out everything that is being done to prevent attacks in the future, because my methods may evolve, and there are already a lot of good articles out there on how to harden WordPress.</p>

<p>In short, here are some new things I’m doing:</p>

<ul>
  <li>Enable Two Factor Authentication - <a href="https://www.wordfence.com/">Plugin</a></li>
  <li>Enable brute force attack protection - <a href="https://www.wordfence.com/">Plugin</a></li>
  <li>A few other tricks up my sleeve…..</li>
</ul>

<h2 id="what-about-the-old-content">What about the old content?</h2>

<p>I have the articles saved. I might re-upload a few more important posts at a later point in time, but I’m not in any hurry.</p>

<p>Cover Photo by <a href="https://unsplash.com/@cbpsc1?utm_source=unsplash&amp;utm_medium=referral&amp;utm_content=creditCopyText">Clint Patterson</a> on <a href="https://unsplash.com/s/photos/hacker?utm_source=unsplash&amp;utm_medium=referral&amp;utm_content=creditCopyText">Unsplash</a></p>]]></content><author><name>Ryan Veach</name></author><category term="meta" /><category term="security" /><summary type="html"><![CDATA[For anybody following along, this site has been down for a few months.]]></summary></entry></feed>