About a year ago, I got into cycling. Naturally, since I’m a bit of a data nerd, I started tracking my rides, so I could keep track of my progress. For the unaware, cycling can be a pretty expensive hobby, so in starting out, I chose to use my phone for GPS tracking using Strava and RideWithGPS. I honestly had no complaints, until I wanted to add in my heart rate….
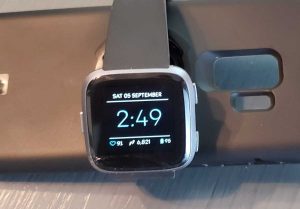
In trying to keep with what I already own, I dusted off my cracked Fitbit Versa, attempted to seal the crack, strapped it on, and tried it out. While it will record cycling activities, the resulting data only recorded tracking points every 5 seconds. This is nowhere near the 1 second accuracy I’m able to get using the phone apps. While many would stop here and just chose to live with lower accuracy or lack of heart rate, I chose to press on and make it work.
Data Flow
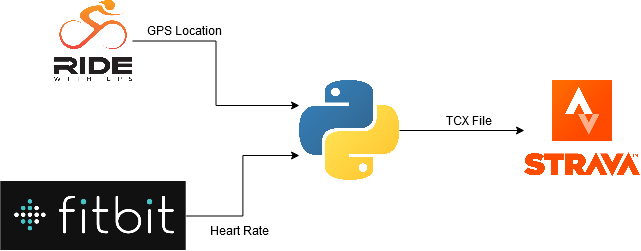
In order for this to work, I knew I needed both GPS location from an app on my phone plus heart rate from my Fitbit. Because app allows deleting or modifying an existing ride, I needed to choose one app to record, and another to visualize. This choice was rather easy, because I feel that RideWithGPS is better for riding and Strava is better for Social.
My plan was to pull data from RideWithGPS and Fitbit API’s, combine it, then format it so it could be read by Strava (TCX).
I chose to write this as a Python script. Due to some previous work I’d done to analyze my stats, I chose to write it as a management script for an existing Django project, but I will try to focus on the more unique aspects of this task.
Location Data from RideWithGPS
For me, GPS logging is the most critical piece of information. I really enjoy tracking and conquering my personal bests on Strava Segments, so this is my primary data source. I did not want to alter it any way, just merge in the heart rate information where possible.
Before I even got started, I recorded a test ride with RideWithGPS, and found that it only recorded every other second, but luckily, that’s easily configured in the settings.
Their API is simple, but easy to navigate. It’s possible to get a list of a user’s ride, then pull individual ride details. Nested a couple layers deep in the ride details, we’re given elevation (meters), time (unix timestamp), x (longitude), and y (latitude).
{
  "e": 236.4815364,
  "t": 1598482303,
  "x": -94.4359419,
  "y": 39.2367653
},
{
  "e": 236.4665218,
  "t": 1598482304,
  "x": -94.435941,
  "y": 39.2367631
},
In my script, I used requests to pull the data, resulting in a dictionary-like object. That’s fine, but Pandas is better….
import pandas as pd

activity_df = pd.DataFrame(
    ride_detail.get('trip').get('track_points')
)
What we get is something like this:
                 e             x            y             t
   0    236.481536    -94.435942    39.236765    1598482303
   1    236.466522    -94.435941    39.236763    1598482403
   2    236.344946    -94.435940    39.236762    1598482503
   3    236.278519    -94.435938    39.236762    1598482603
   4    236.260699    -94.435933    39.236764    1598482703
...            ...           ...          ...           ...
4798    234.847334    -94.435919    39.236706    1598531700
4799    234.841117    -94.435915    39.236708    1598531701
4800    234.942241    -94.435913    39.236708    1598531702
4801    234.961215    -94.435914    39.236708    1598531703
4802    234.858422    -94.435909    39.236709    1598531704
So, let’s turn those integer timestamps into real timestamps with time zones. While we’re at it, let’s rename some columns to match the TCX spec:
import datetime
import pytz
from django.utils.timezone import make_aware

# get a utc timezone object
utcz = pytz.timezone('utc')

def get_dt(time_stamp:int):
    """ convert timestamp to timezone aware datetime """
    return make_aware(
        datetime.datetime.utcfromtimestamp(time_stamp),
        timezone=utcz,
)

# create a new Column 'Time', and populate
# it with timezone-aware timezones
activity_df['Time'] = activity_df['t'].apply(self.ts_to_dt)

# rename some columns to match TCX Spec, and drop 't'
# which is no longer needed.
activity_df.rename(
    columns={
        "y": "LatitudeDegrees",
        "x": "LongitudeDegrees",
        "e": "AltitudeMeters",
    },
    inplace=True,
)
activity_df.drop(columns=['t'], inplace=True)
This gives us something a little more human readable:
      AltitudeMeters  LongitudeDegrees  LatitudeDegrees                      Time
0         236.481536        -94.435942        39.236765 2020-08-26 22:51:43+00:00
1         236.466522        -94.435941        39.236763 2020-08-26 22:51:44+00:00
2         236.344946        -94.435940        39.236762 2020-08-26 22:51:45+00:00
3         236.278519        -94.435938        39.236762 2020-08-26 22:51:46+00:00
4         236.260699        -94.435933        39.236764 2020-08-26 22:51:47+00:00
...              ...               ...              ...                       ...
4798      234.847334        -94.435919        39.236706 2020-08-27 00:35:00+00:00
4799      234.841117        -94.435915        39.236708 2020-08-27 00:35:01+00:00
4800      234.942241        -94.435913        39.236708 2020-08-27 00:35:02+00:00
4801      234.961215        -94.435914        39.236708 2020-08-27 00:35:03+00:00
4802      234.858422        -94.435909        39.236709 2020-08-27 00:35:04+00:00
Retrieving Heart Rate Data
In order to pull minute-by-minute data from the Fitbit API, I had to create a “Personal” project, which would only allow me access to my own fitness data. This is done through the Heart Rate Intraday Time Series endpoints.
The data was returned with time only, missing date and timezone information. It actually looks something like this, yikes!
    "activities-heart-intraday": {
        "dataset": [
            {
                "time": "00:00:00",
                "value": 64
            },
            {
                "time": "00:00:10",
                "value": 63
            }
        ],
        "datasetInterval": 1,
        "datasetType": "second"
    }
Luckily, the timezone can be retrieved through the user’s profile endpoint, which returns the timezone name. In my case, ‘America/Chicago’.
Before going any further, let’s add a column to our first DataFrame displaying our time in the same zone as Fitbit:
# fitbit_tz is a dictionary object representing the response
# from the user's profile api endpoint.
# returns: America/Chicago
fitbit_tz = pytz.timezone(
    fitbit_profile.get('user').get('timezone')
)

# We're going to add a new column, 'FitbitTZ' in addition
# to the other ones:
activity_df['FitbitTZ'] = activity_df['Time'].apply(
    lambda x: x.tz_convert(fitbit_tz)
)
Here, you can see the new column. It’s the same timestamp, just displayed in a different timezone. To keep everything on one line, I’ve removed the coordinate and altitude columns to showcase the time zones:
                            Time                  FitbitTZ
0      2020-08-26 22:51:43+00:00 2020-08-26 17:51:43-05:00
1      2020-08-26 22:51:44+00:00 2020-08-26 17:51:44-05:00
2      2020-08-26 22:51:45+00:00 2020-08-26 17:51:45-05:00
3      2020-08-26 22:51:46+00:00 2020-08-26 17:51:46-05:00
4      2020-08-26 22:51:47+00:00 2020-08-26 17:51:47-05:00
...                          ...                       ...
4798   2020-08-27 00:35:00+00:00 2020-08-26 19:35:00-05:00
4799   2020-08-27 00:35:01+00:00 2020-08-26 19:35:01-05:00
4800   2020-08-27 00:35:02+00:00 2020-08-26 19:35:02-05:00
4801   2020-08-27 00:35:03+00:00 2020-08-26 19:35:03-05:00
4802   2020-08-27 00:35:04+00:00 2020-08-26 19:35:04-05:00
In my testing, I found that the Fitbit Heart Rate Intraday Series wouldn’t return more than 24 hours of data, and to avoid complex logic, I just did full day data pulls for each day found in the activity.
Pandas makes it easy to get a unique list of the dates:
fitbit_dates = activity_df['FitbitTZ'].apply(
    lambda x: x.date()
).unique().tolist()
Then, for each date, we retrieve a dictionary object, and turn those date strings into a dictionary object reflecting a timezone-naive datetime paired with the heart rate value.
Where hr_data is a dictionary object from the API and day is a datetime.date object:
hr_series = list(map(
    lambda x: {
        "time": datetime.datetime.combine(
            day,
            datetime.datetime.strptime(x.get('time'), '%H:%M:%S').time(),
        ),
        "value": x.get('value'),
    },
    hr_data.get('activities-heart-intraday').get('dataset'),
))
That data is then converted into yet another Pandas DataFrame, where we use django.utils.timezone.make_aware again to add the correct timezone onto the data. I’ll name it hr_df, for short:
        hr                      hr_time
0       61    2020-08-26 00:00:04-05:00
1       60    2020-08-26 00:00:14-05:00
2       59    2020-08-26 00:00:24-05:00
3       58    2020-08-26 00:00:29-05:00
4       57    2020-08-26 00:00:34-05:00
...     ..                          ...
5894    90    2020-08-26 20:09:26-05:00
5895    91    2020-08-26 20:09:41-05:00
5896    91    2020-08-26 20:09:56-05:00
5897    89    2020-08-26 20:10:01-05:00
5898    88    2020-08-26 20:10:06-05:00
Merging the Data
Now, we have two different data sets, both stored in Pandas DataFrames. Each contains timeseries data, but the times don’t match. Thankfully, this is easily solved with Pandas’s merge_asof method. This is like a database left join, except it will match on the nearest key rather than equal keys. Perfect!
As previously mentioned, our GPS information is the critical piece, so we’re going to use that as our left table, and merge in the heart rate data as a best fit:
activity_df = pd.merge_asof(
    activity_df.sort_values("FitbitTZ"),
    hr_df.sort_values("hr_time"),
    left_on="FitbitTZ",
    right_on="hr_time",
).drop(columns=["FitbitTZ", "hr_time"]) \
    .sort_values('Time').fillna(method='ffill')
This gives us a table with all the information we need to create the entire activity. Shown with abbreviated column names and date for spacing:
              Alt          Lng         Lat             Time   hr
0      236.481536   -94.435942   39.236765   22:51:43+00:00   98
1      236.466522   -94.435941   39.236763   22:51:44+00:00   98
2      236.344946   -94.435940   39.236762   22:51:45+00:00   98
3      236.278519   -94.435938   39.236762   22:51:46+00:00   98
4      236.260699   -94.435933   39.236764   22:51:47+00:00   98
...           ...          ...         ...              ...  ...
4798   234.847334   -94.435919   39.236706   00:35:00+00:00  141
4799   234.841117   -94.435915   39.236708   00:35:01+00:00  141
4800   234.942241   -94.435913   39.236708   00:35:02+00:00  141
4801   234.961215   -94.435914   39.236708   00:35:03+00:00  141
4802   234.858422   -94.435909   39.236709   00:35:04+00:00  141
Formatting For Upload
This is already a long enough article, so I’m going to keep this brief. Of the file formats available, I chose Training Center XML (TCX), since it’s a fairly simple XML schema. Once I had the data, it was a matter of tracking down information on the TCX file format and copying it.
I accomplished this using ElementTree, wrote it to a BytesIO object, then uploaded to Strava using requests.
Success!
A ride with heart rate data!
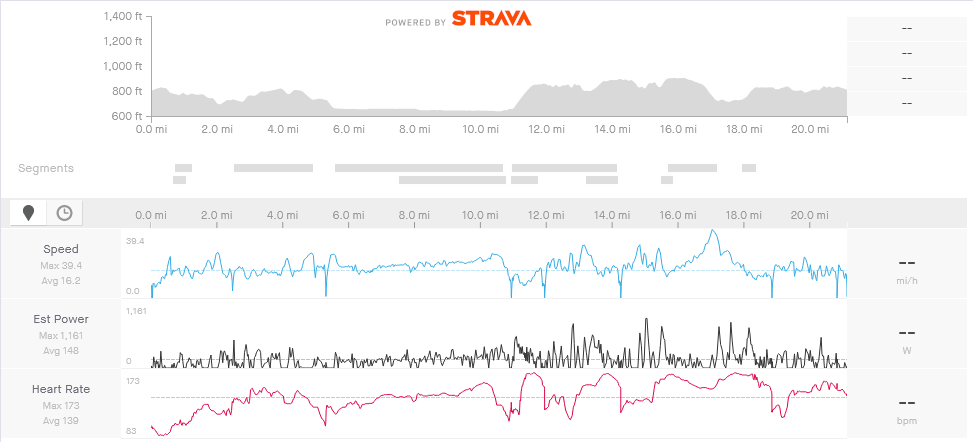
Ride Analysis with Heart Rate 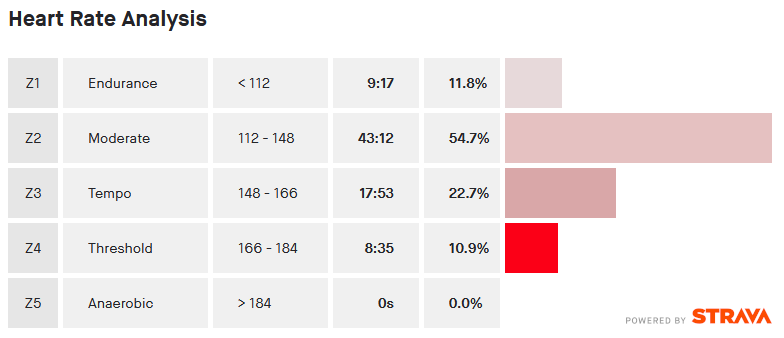
Heart Rate Analysis From Ride
Takeaways
In general, most fitness apps function like walled gardens. Depending on how it’s tracked, it may be very difficult to get a complete picture of everything. As a data nerd, this is incredibly frustrating.
This was a fun problem to solve, as I got to punch a hole through some of these walls. I’ve been using this script for about a week without any issues. Unfortunately, I think it’s a bit of a temporary situation. There are a lot of moving pieces, and many different things could affect the data availability.
As far as Fitbit, I honestly can’t recommend them for anything other than a casual step tracker. In 2018, I had the opportunity to pick up a Fitbit Versa through a former employer’s health plan, but found it to be lackluster in the smart watch capabilities and fragile. Disappointingly, the screen cracked in a minor tumble about a week after I got it. I really get nothing out of their health dashboard either, so I use it like a dumb watch that also records my heart rate.
I actually plan on buying into a device ecosystem that already has everything I need all in one place. So, essentially, I’ll be throwing money at the problem, but I think it’ll give me a much better experience. In the long run, it’ll be money well spent for my new favorite hobby.
This is beyond impressive. This is like Christopher Nolan’s way of explaining fitness.